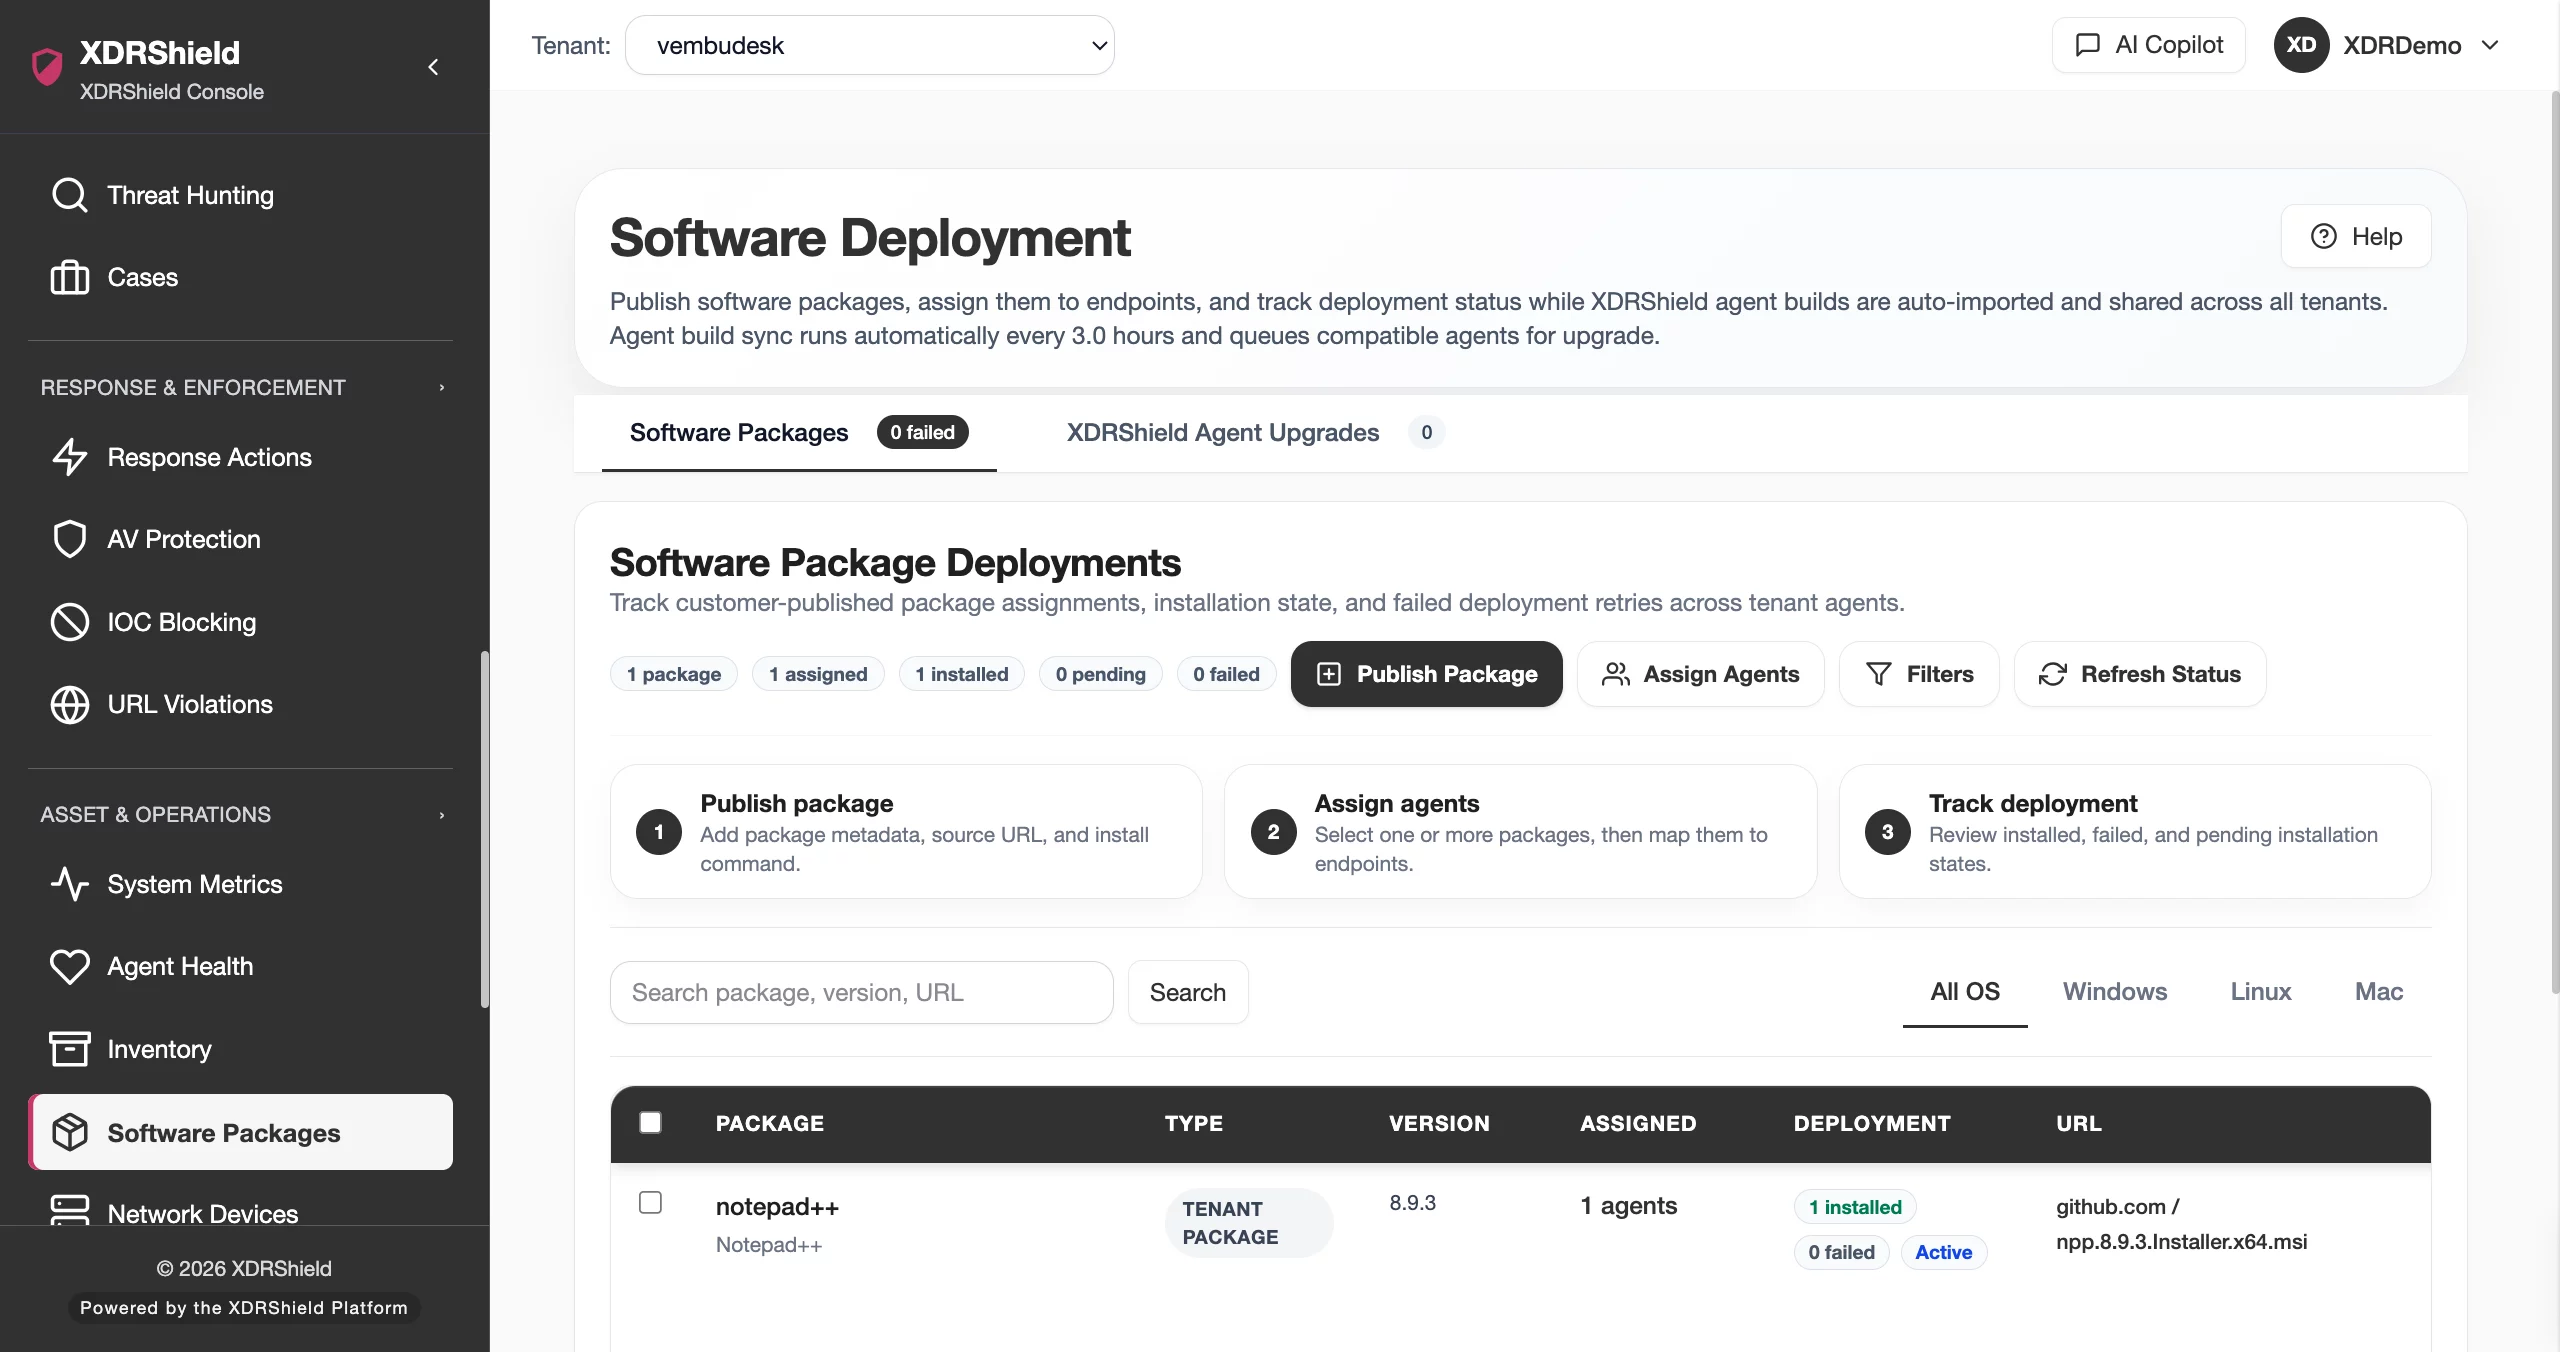
Define resource and performance thresholds that expose endpoint health and suspicious abuse.
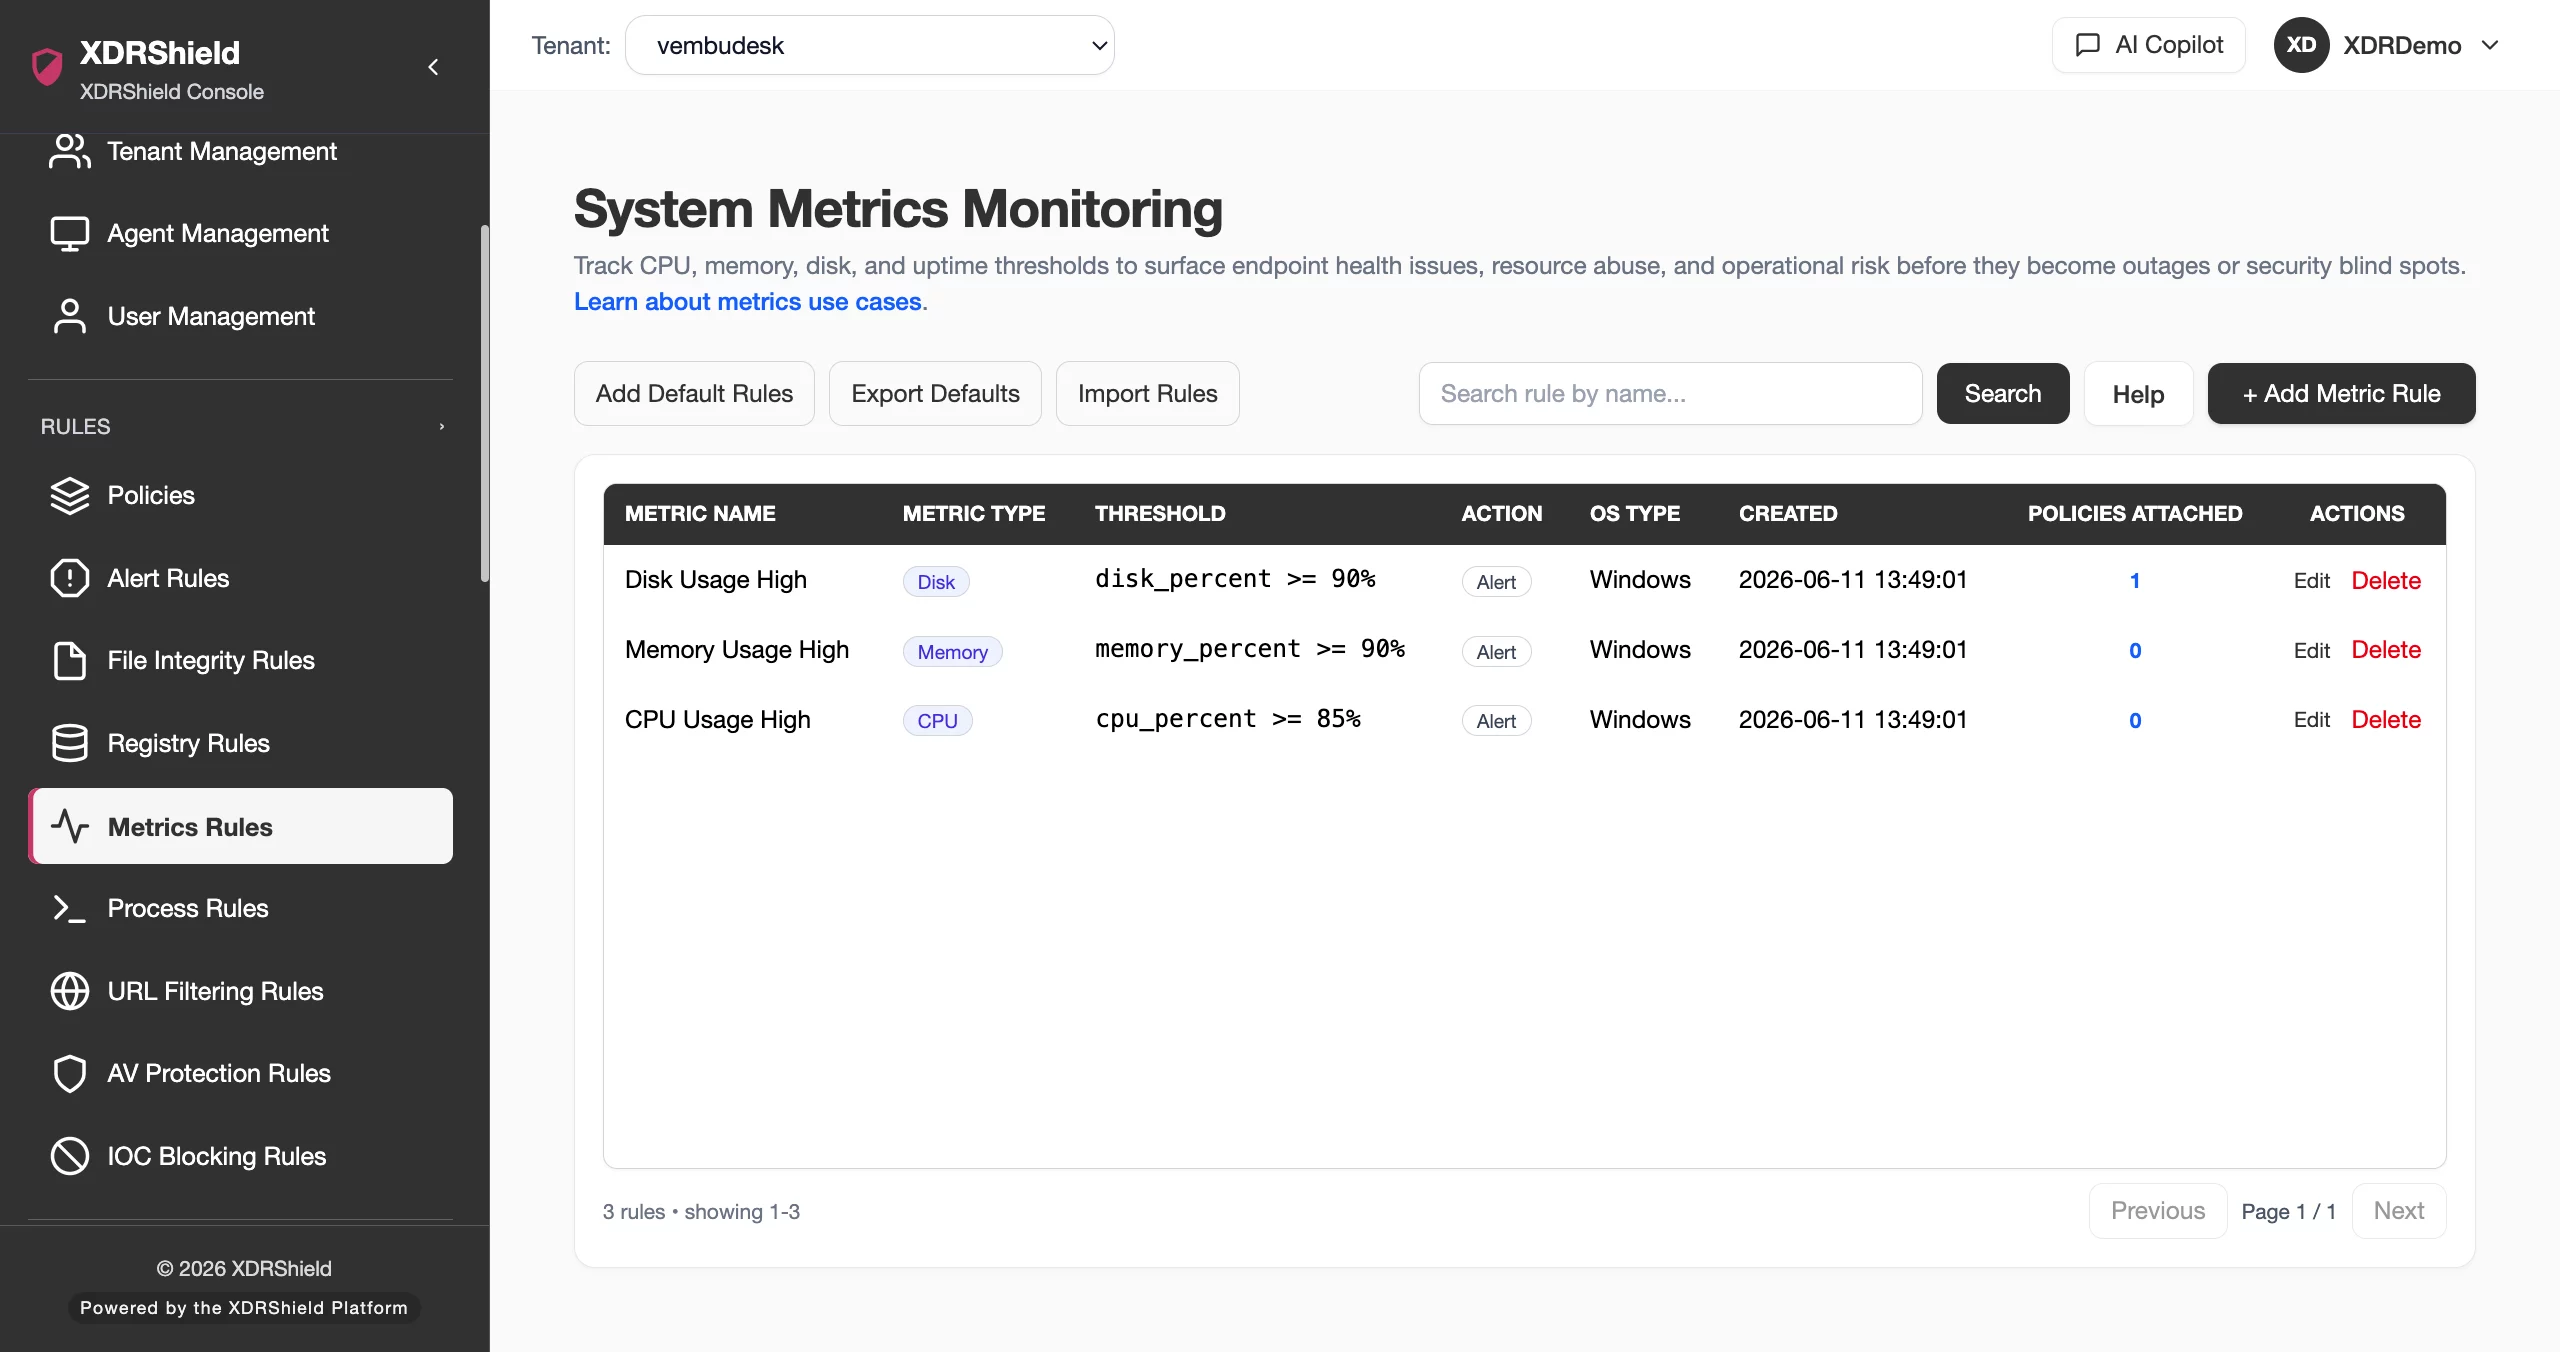
XDRShield System Metrics Rules help teams monitor CPU, memory, disk, and related endpoint-resource signals so operational stress, suspicious resource abuse, and unhealthy endpoints can be surfaced with policy-driven rules.
Resource anomalies often explain both outages and suspicious activity.
High CPU, memory pressure, disk usage, or abnormal resource behavior can indicate operational problems, misconfiguration, or malware-like activity. Metrics rules make those signals visible and reviewable.
Create metrics thresholds and distribute them through endpoint policies.
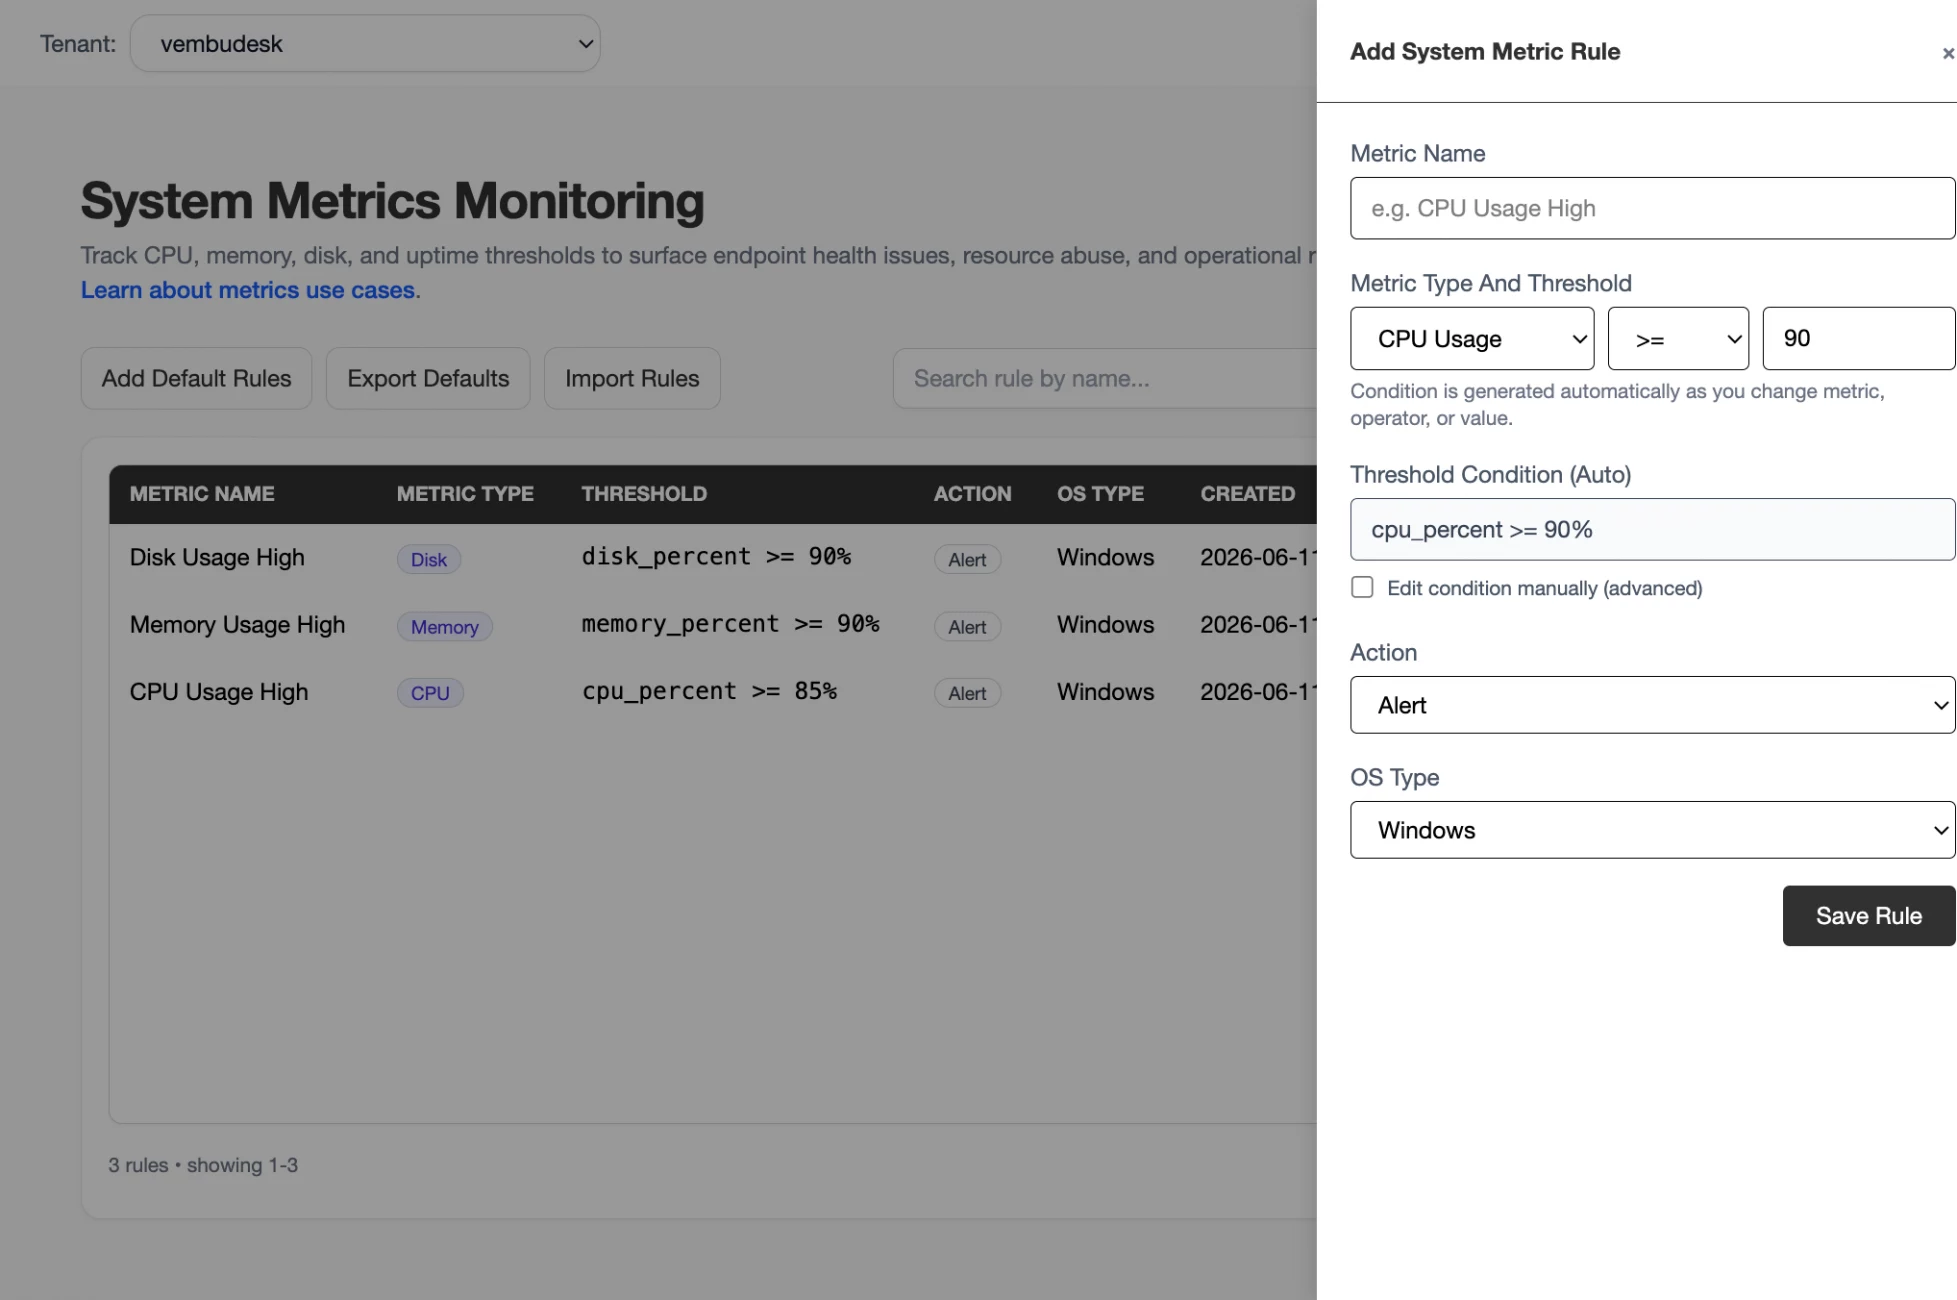
System Metrics Rules define what endpoint resource conditions should be watched and how they should be surfaced. Rules are attached to policies for compatible agents, then metrics findings can support health review, alert triage, and investigation.
- Define thresholds for supported CPU, memory, disk, and system-resource signals.
- Use duration or repeated condition logic where supported to reduce noise.
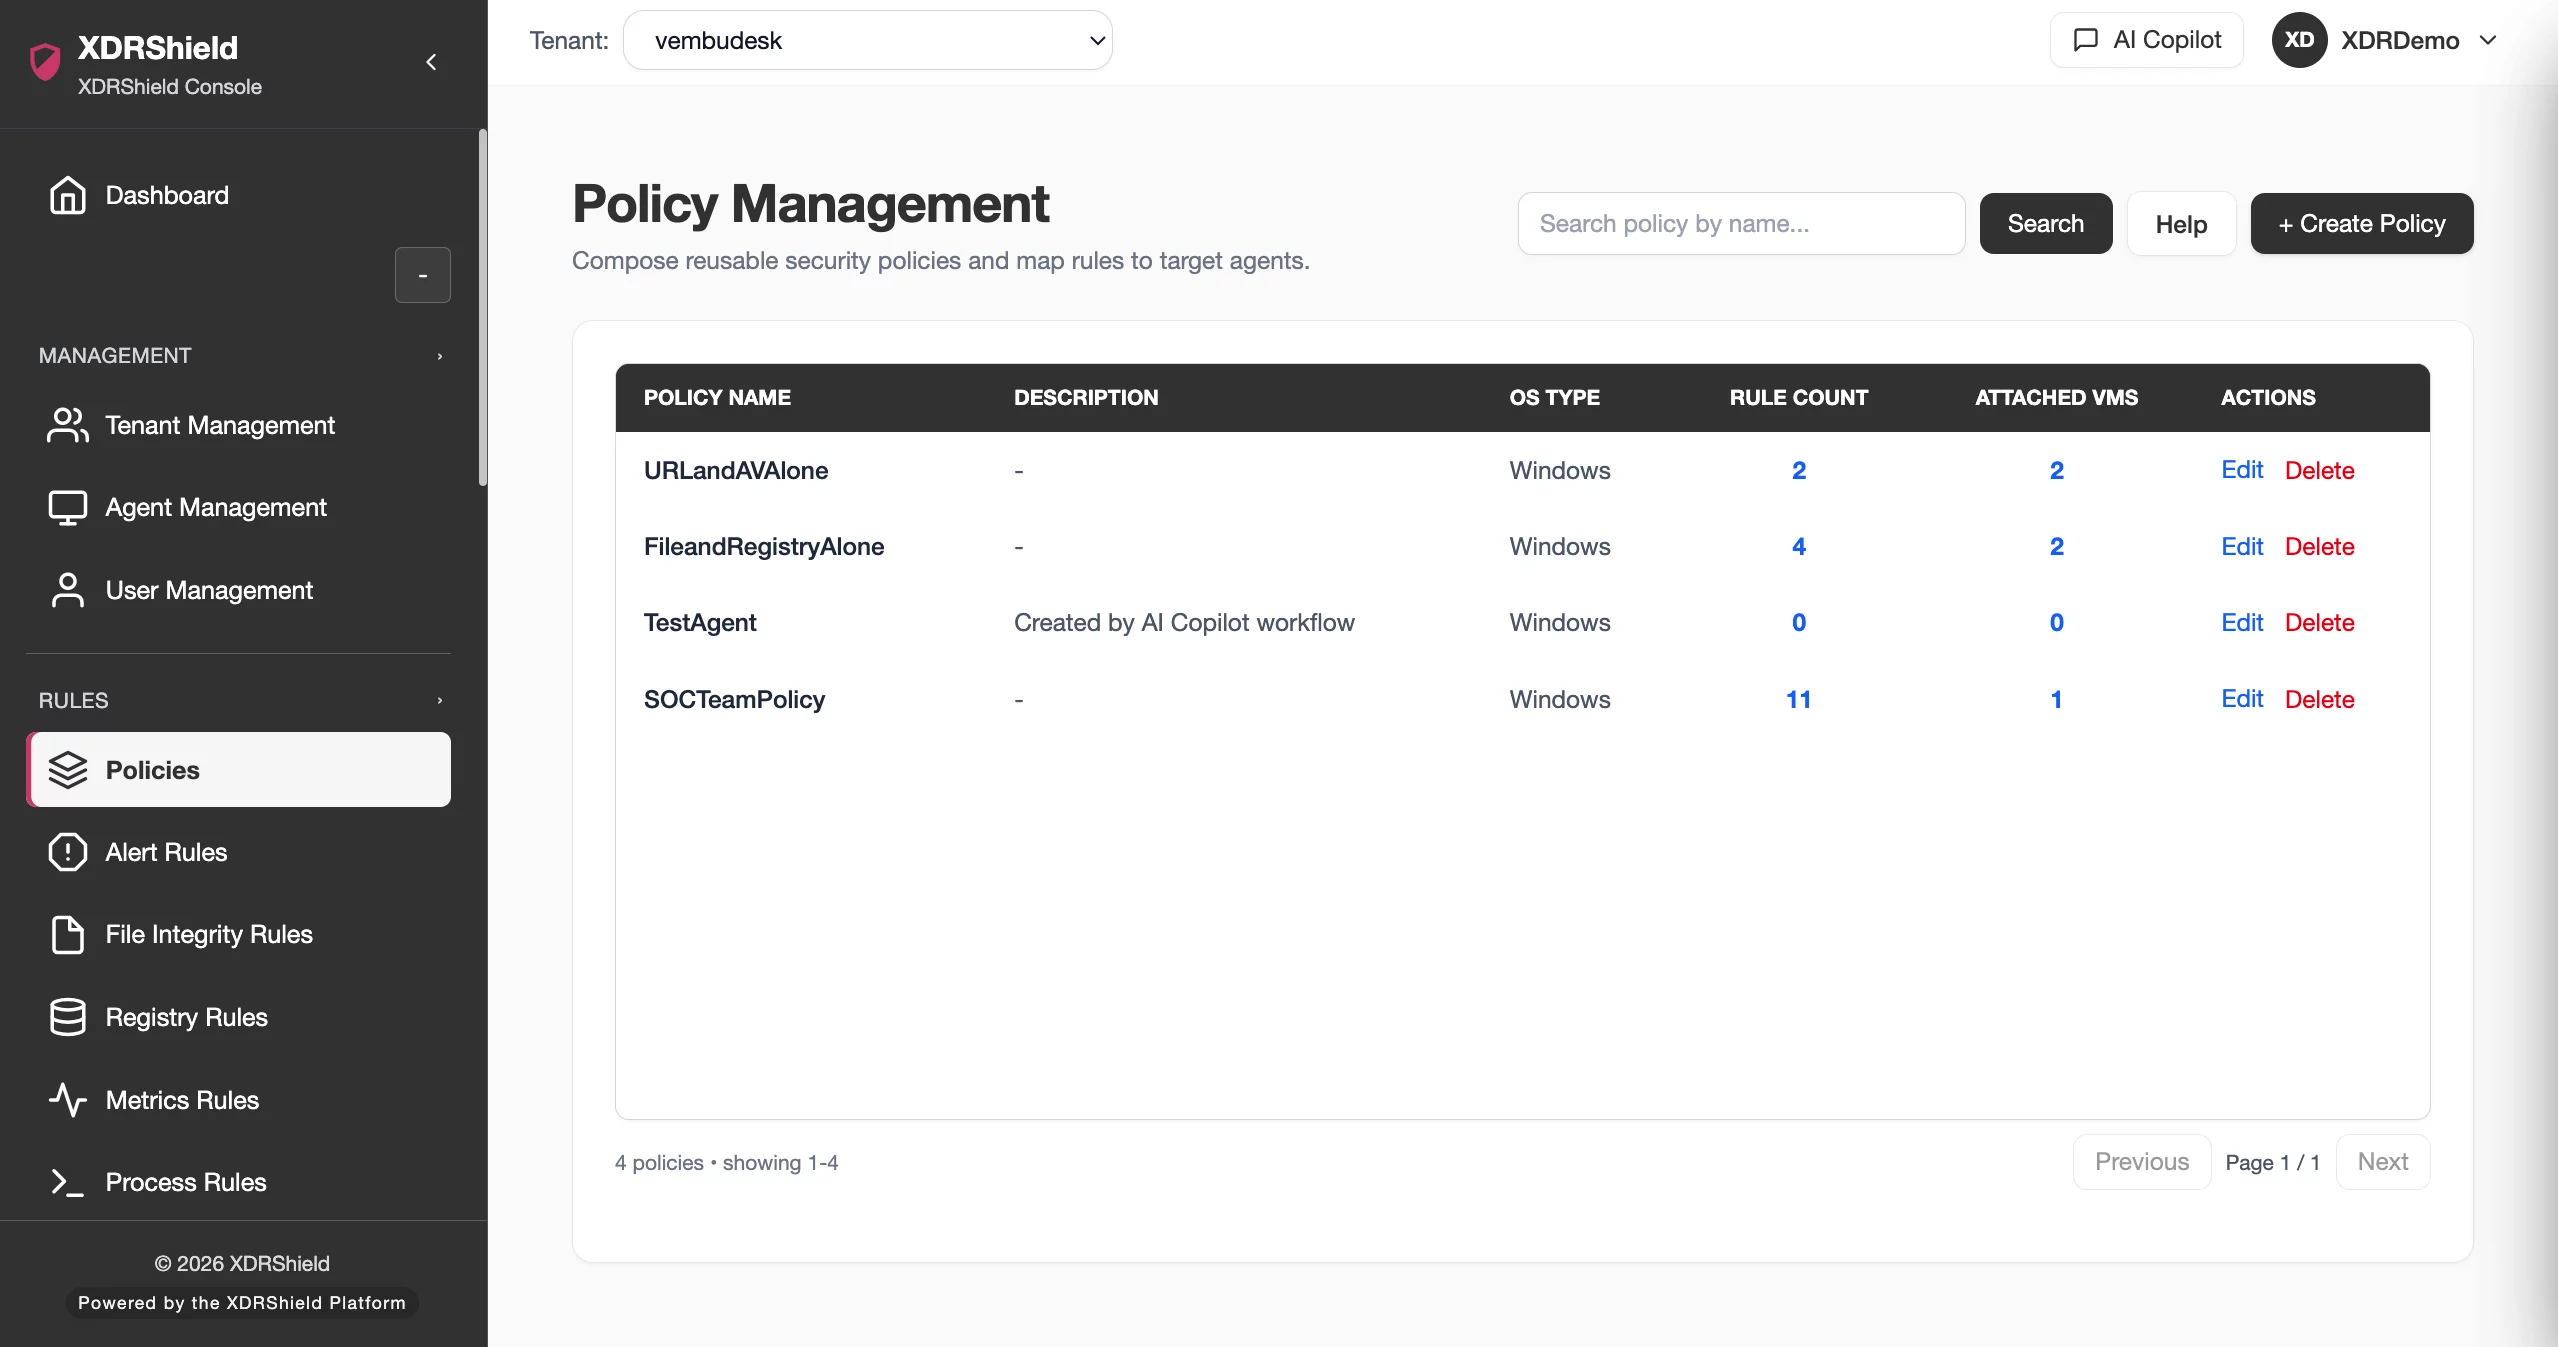
- Attach metrics rules through policies for compatible endpoints.
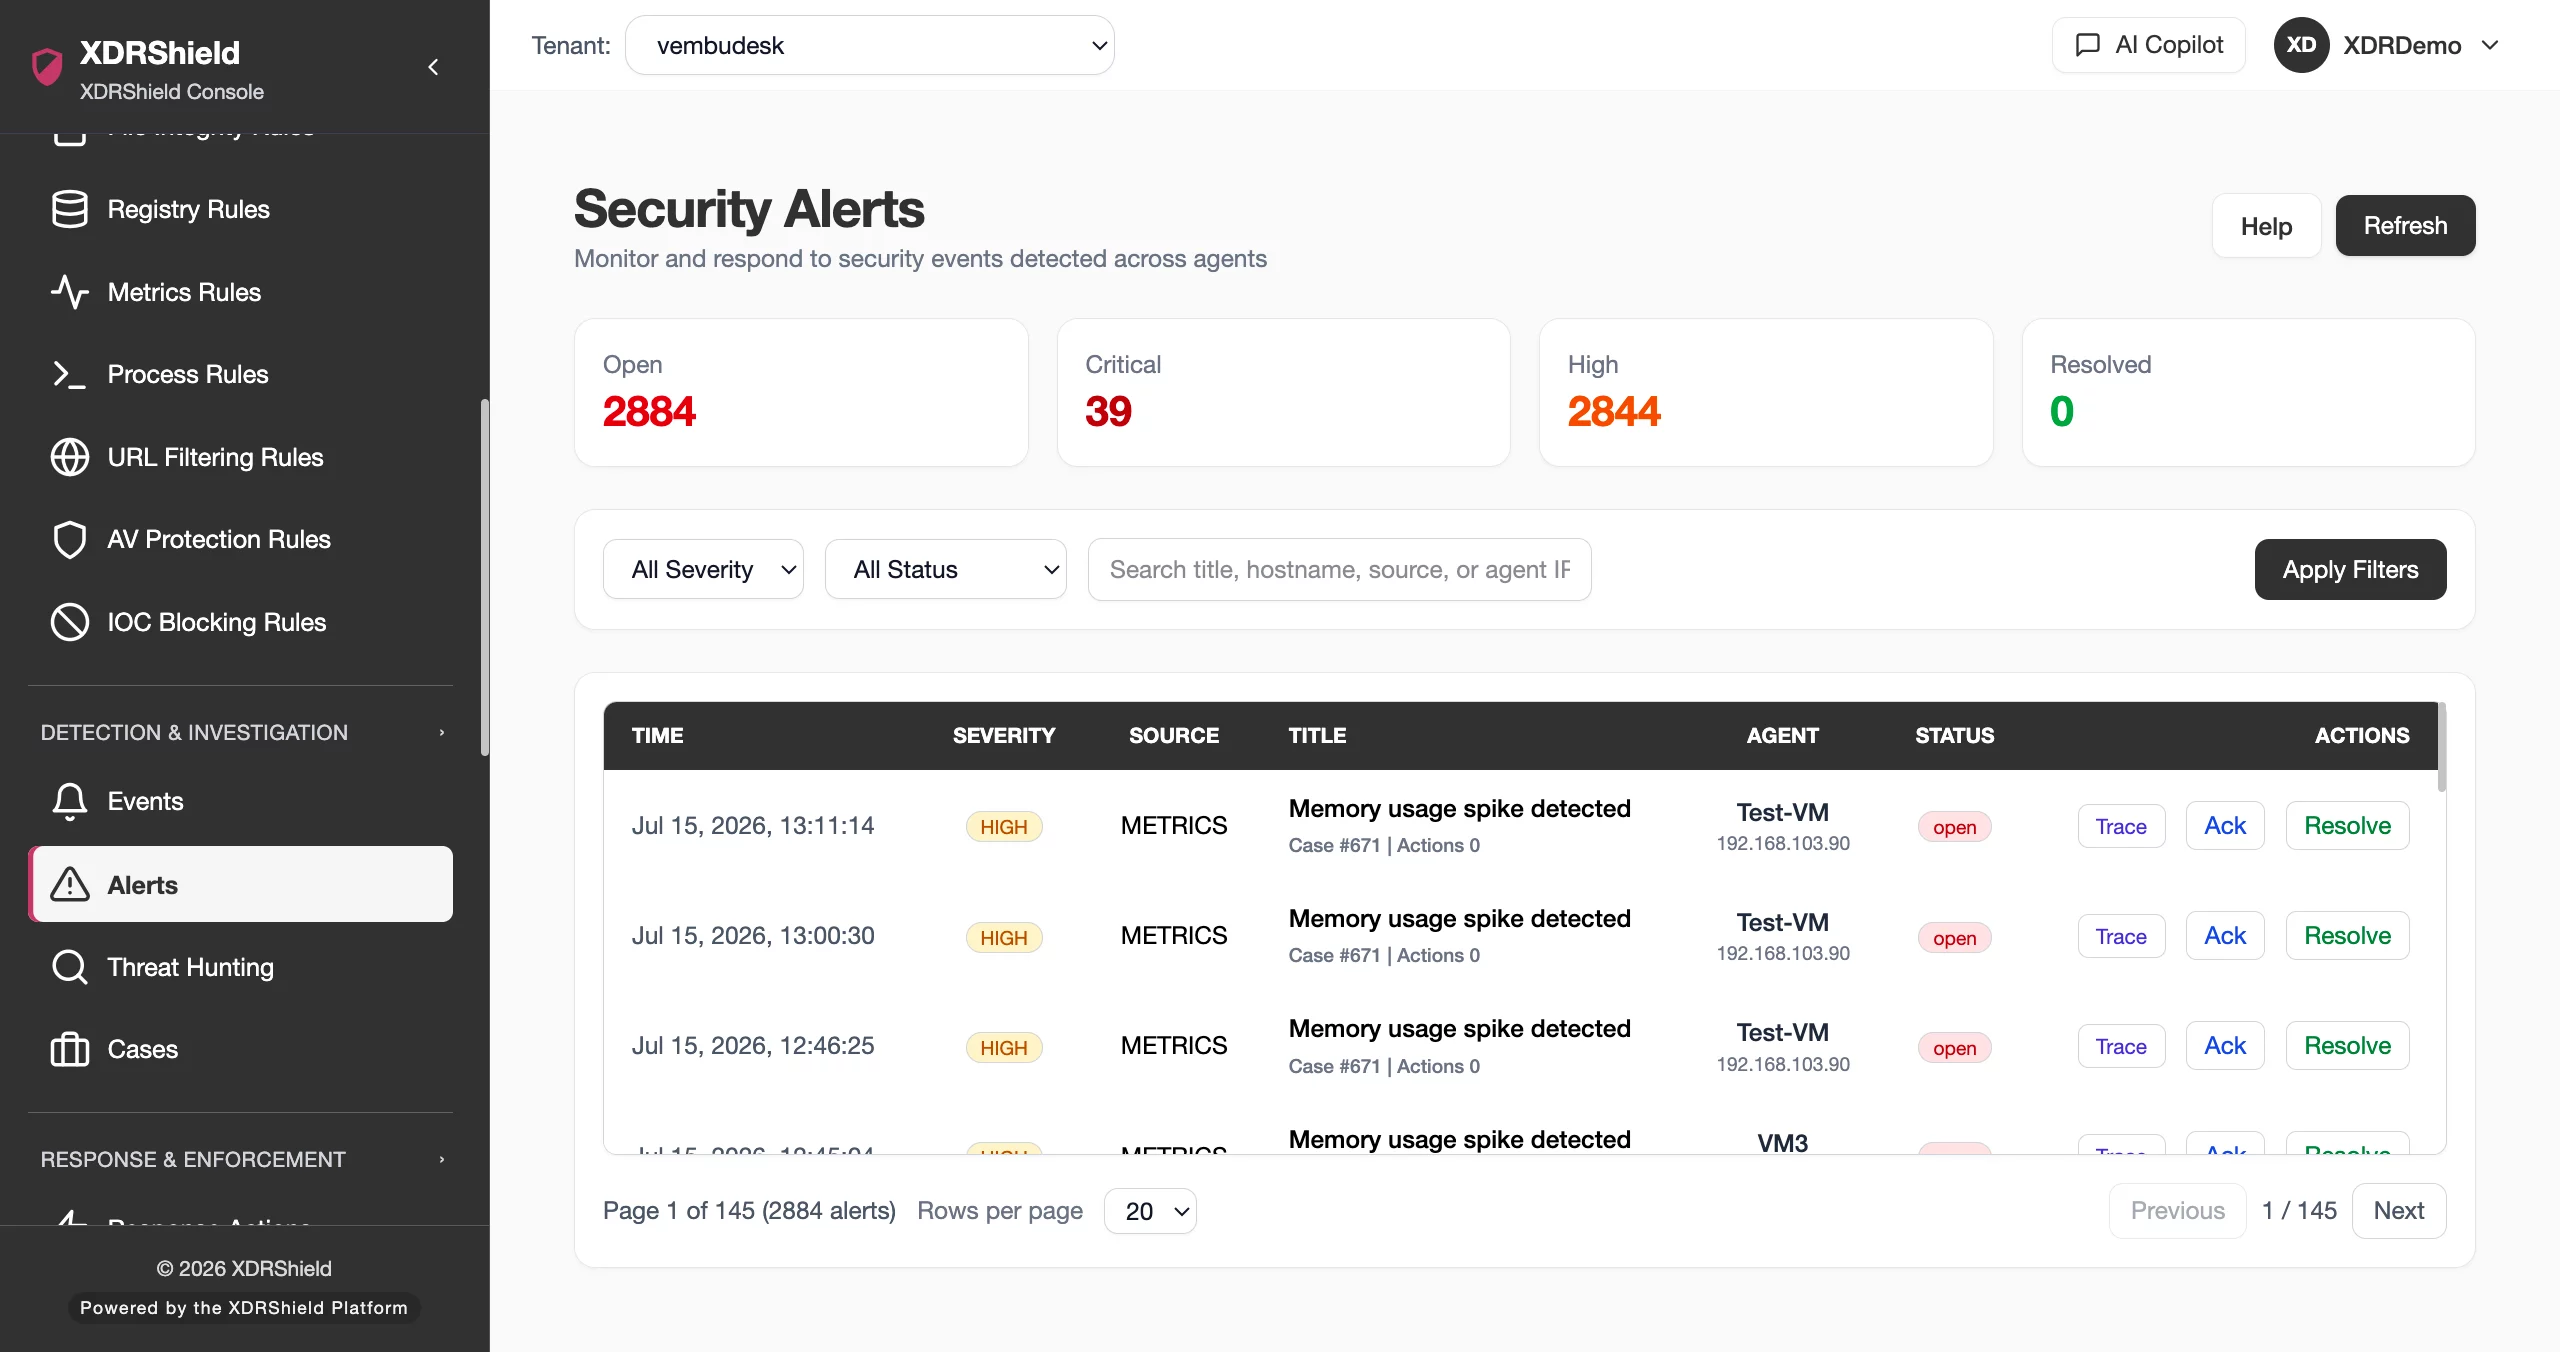
- Review metrics with process, endpoint health, alerts, and case context.
What XDRShield System Metrics Rules helps teams do.
Each capability supports the operating workflow for system metrics rules, from configuration and validation to investigation, governance, and follow-up.
Resource threshold rules
Define CPU, memory, disk, or system-resource thresholds that should be monitored.
Duration-aware monitoring
Reduce noise by requiring sustained or repeated resource conditions where supported.
Anomaly alerting
Surface abnormal endpoint resource conditions for review.
Policy assignment
Distribute metrics rules through endpoint policies.
Endpoint health context
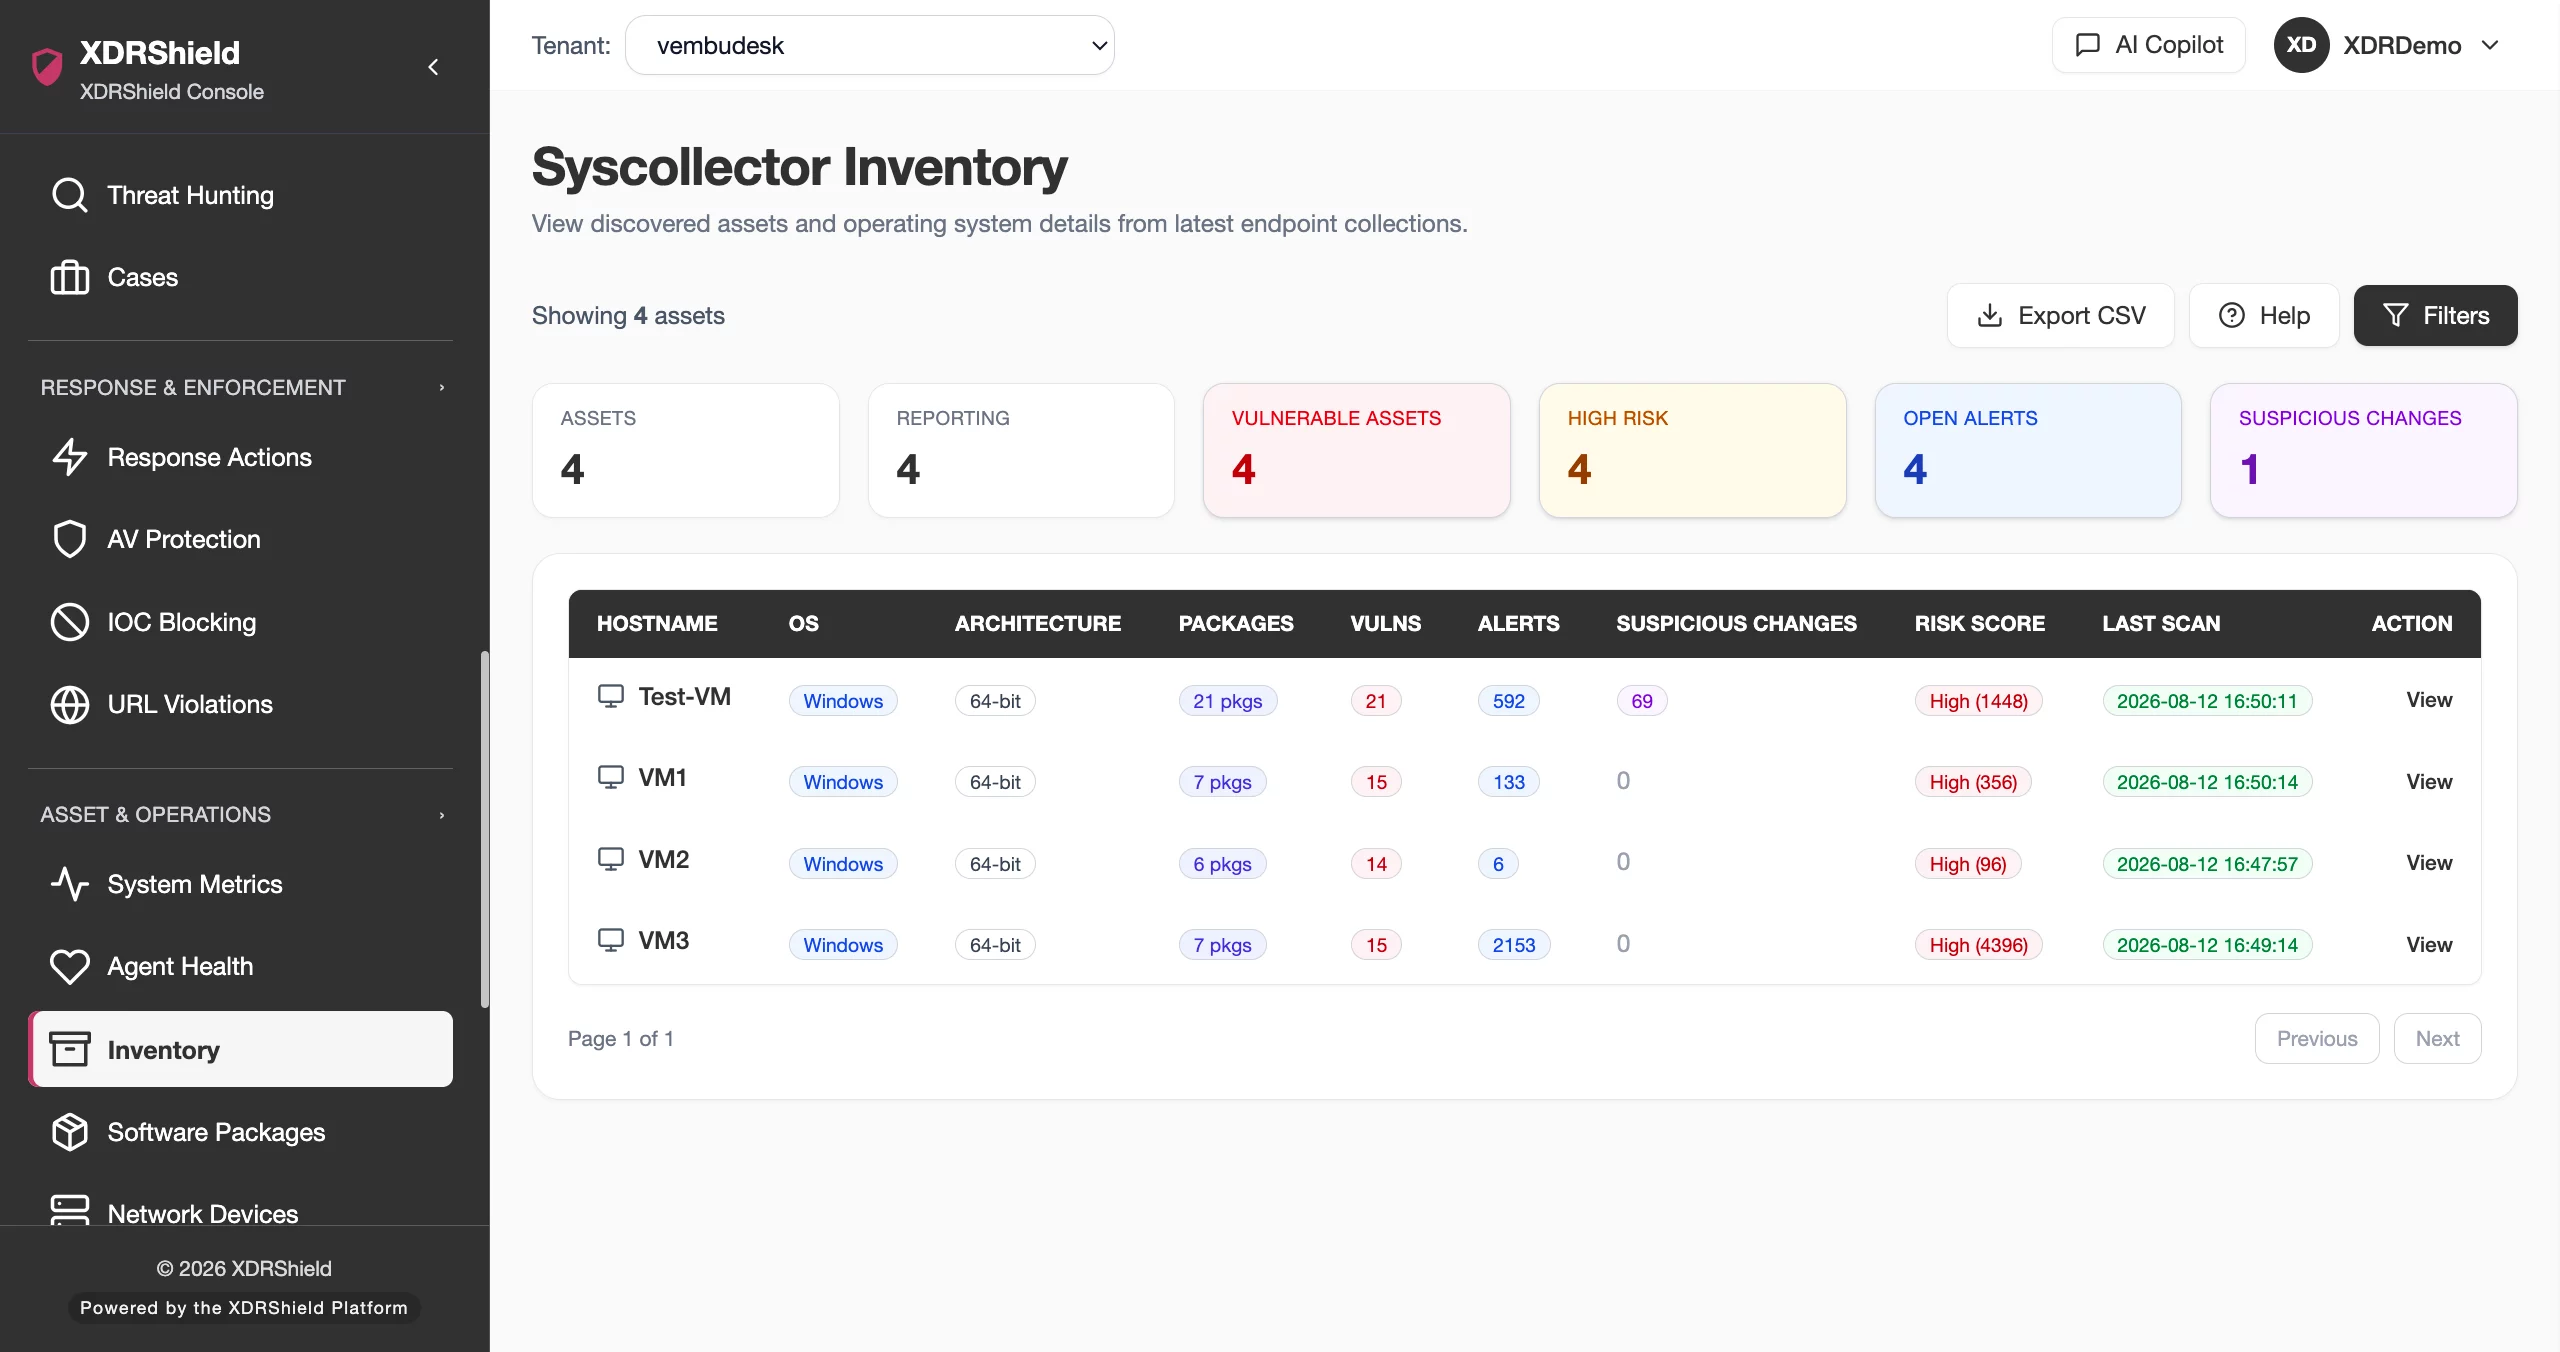
Review metrics signals with agent health and endpoint reporting status.
Process correlation
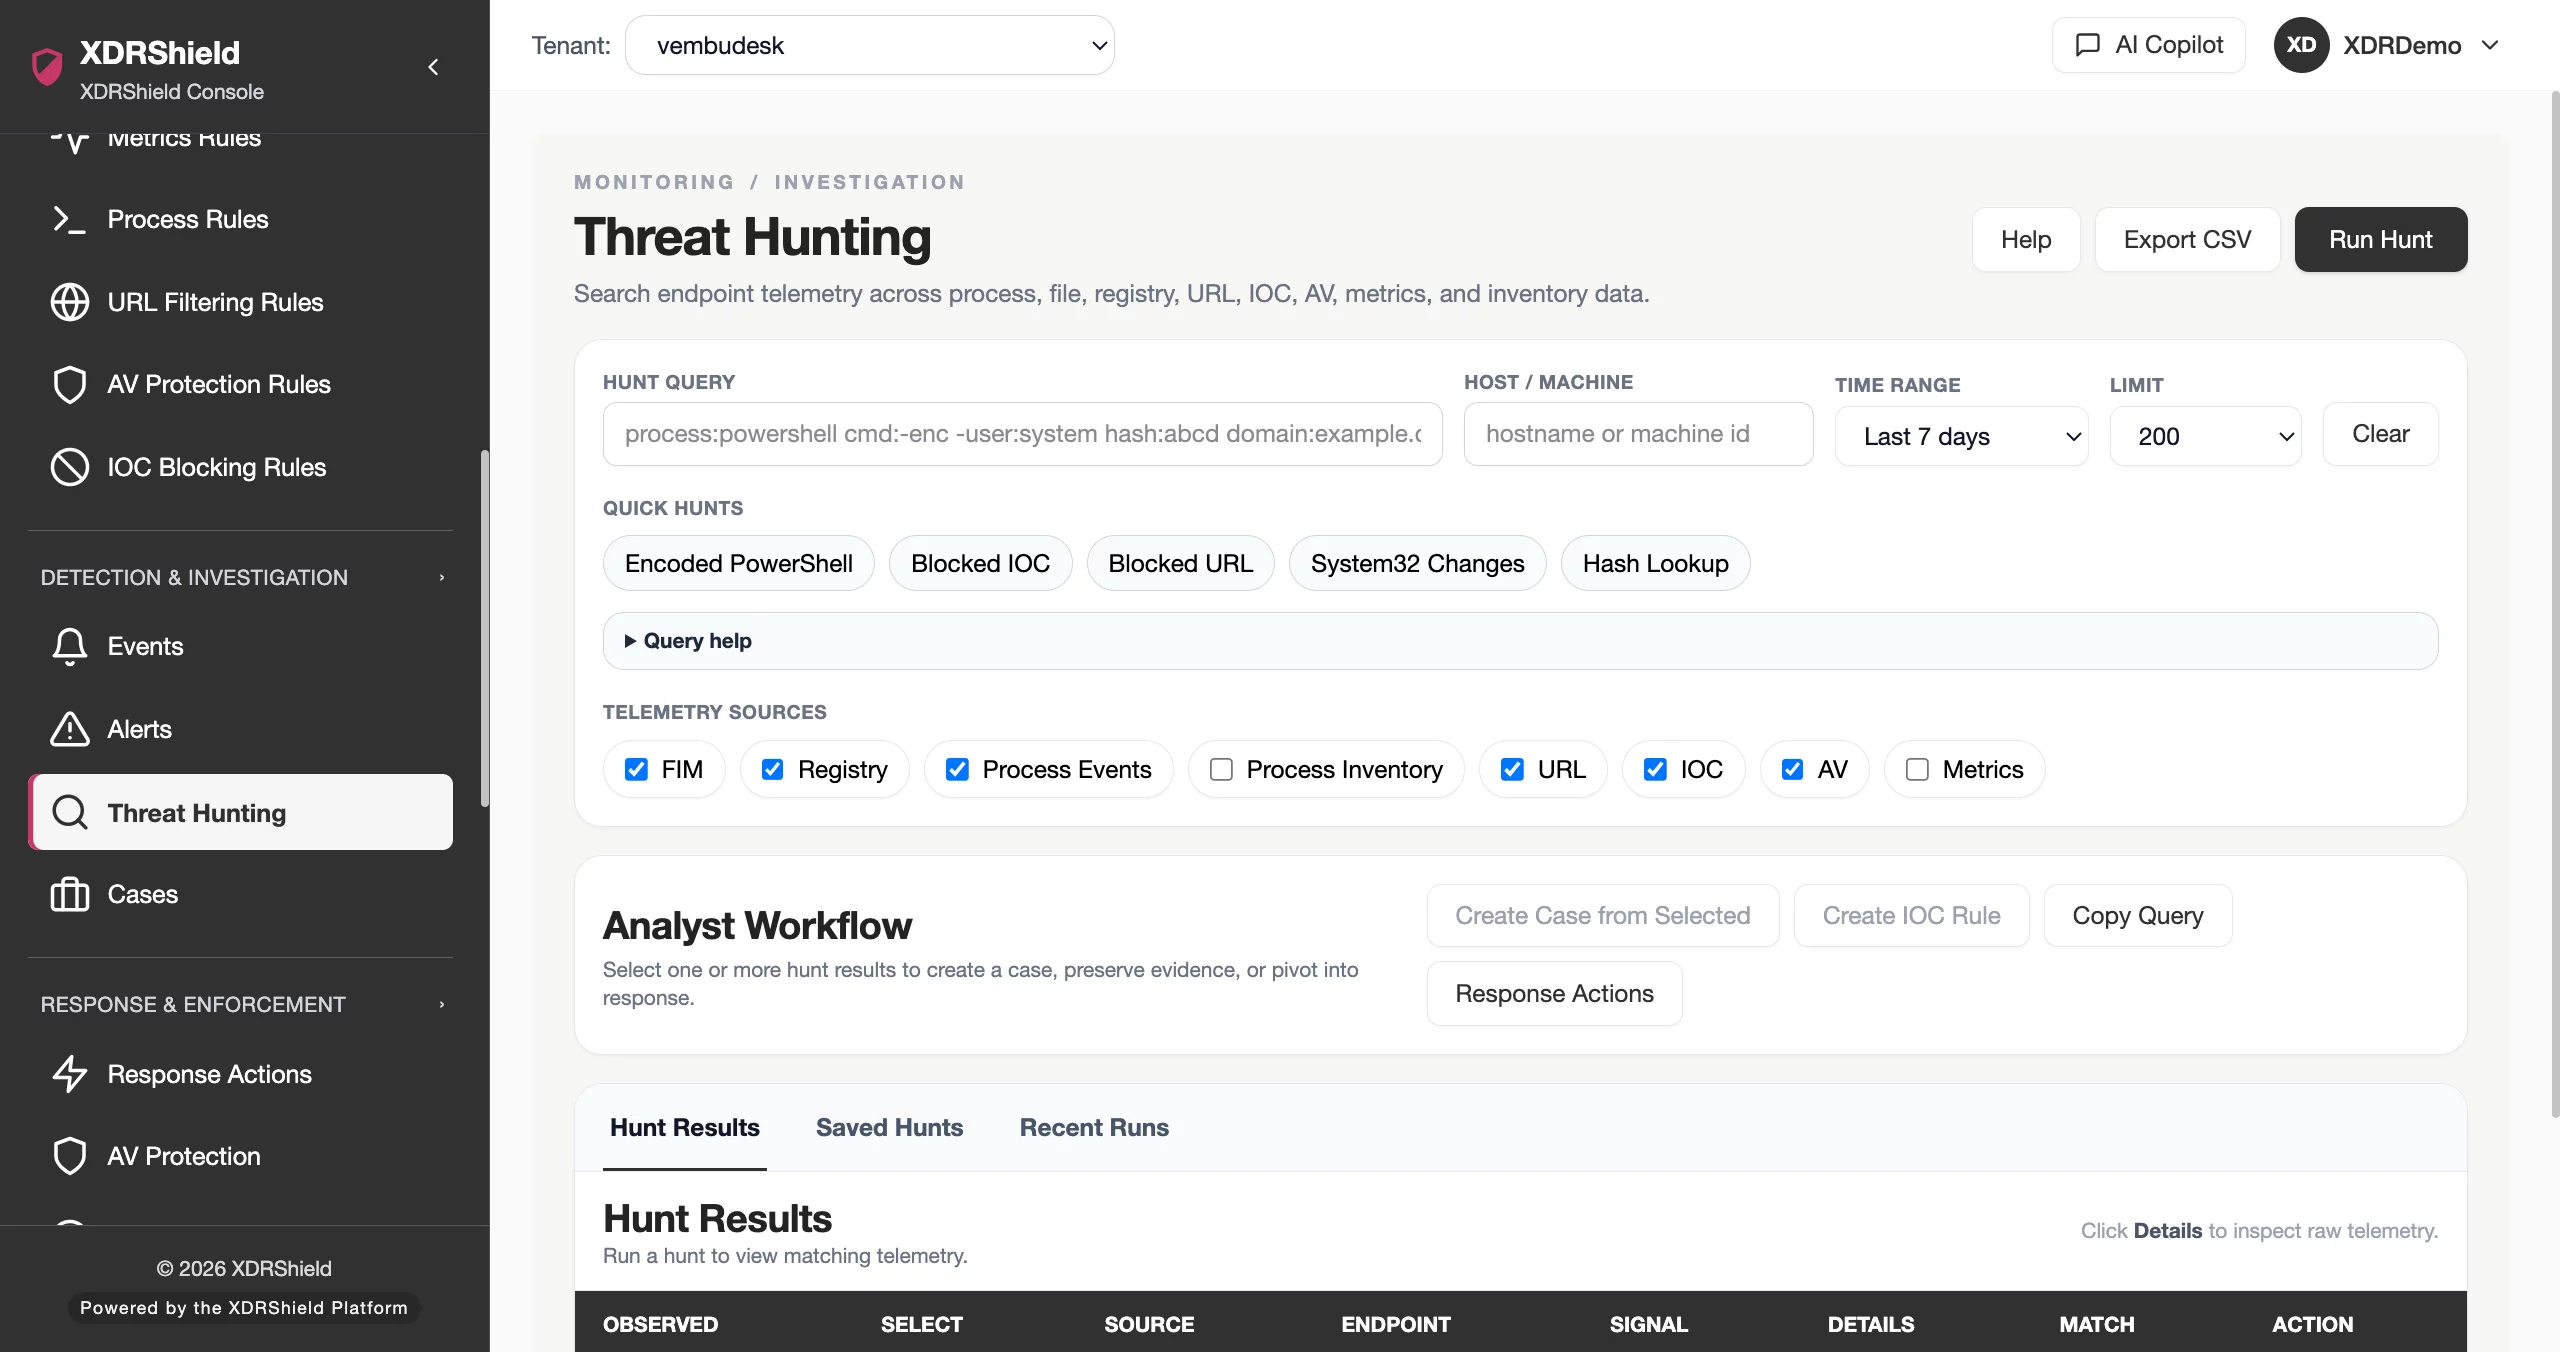
Investigate whether a process explains CPU, memory, or disk pressure.
Operational evidence
Use metrics history for troubleshooting and customer review.
Tenant-scoped monitoring
Apply metrics policies per customer or endpoint group.
From threshold design to actionable metrics signal.
A repeatable system metrics rules workflow keeps configuration deliberate, validated, and traceable.
Choose metric
Select the endpoint resource signal that needs monitoring.
Set threshold
Define value, duration, and severity expectations.
Attach to policy
Map the rule to the correct endpoint policy and tenant scope.
Validate signal
Review reported metrics and alert behavior after rollout.
Correlate context
Check process activity, agent health, and endpoint workload.
Tune noise
Adjust thresholds or scope based on normal environment behavior.
Where System Metrics Rules helps most.
Use system metrics rules where endpoint security outcomes depend on consistent configuration and evidence-backed review.
Endpoint health monitoring
Detect endpoints under resource stress.
Resource abuse detection
Surface suspicious CPU, memory, or disk spikes.
Process investigation
Correlate metrics spikes with process activity.
Capacity trend review
Use repeated threshold signals for operational planning.
Policy standardization
Apply consistent metrics monitoring across endpoint sets.
MSP operations
Monitor customer endpoint health without mixing tenant scope.
Tune thresholds to environment behavior.
This table helps teams avoid noisy metrics rules.
| Area | What it means | How teams use it |
|---|---|---|
| Metric type | CPU, memory, disk, or supported system-resource signal. | Choose based on the operational or security condition being monitored. |
| Threshold | The value that triggers a finding or alert. | Set high enough to avoid normal workload noise. |
| Duration | How long or how often the condition must persist. | Use sustained conditions where supported to reduce false positives. |
| Scope | The endpoint group or tenant receiving the rule. | Apply different thresholds for servers, desktops, and customer environments. |
System Metrics Rules for security, IT, and MSP teams.
System Metrics Rules supports day-to-day operations while keeping tenant scope, evidence, and accountable change control clear.
For security and IT teams
Use this feature to keep endpoint protection, detection evidence, and operational decisions aligned with the current environment.
- Validate configuration before broad rollout.
- Review evidence before changing rules or policies.
- Use related alerts, events, cases, and activity logs for context.
For MSP and service-provider teams
Use tenant-scoped operation so customer environments stay separated while common workflows remain repeatable.
- Confirm customer or tenant scope before bulk changes.
- Standardize configuration patterns across customers.
- Preserve customer-specific audit and review evidence.
System Metrics Rules FAQs.
What are System Metrics Rules in XDRShield?
System Metrics Rules define endpoint resource thresholds such as CPU, memory, disk, and related system signals for monitoring and alerting.
How do metrics rules reduce noise?
Teams can tune thresholds, duration expectations, severity, and scope based on normal workload behavior and endpoint type.
How do metrics connect to investigation?
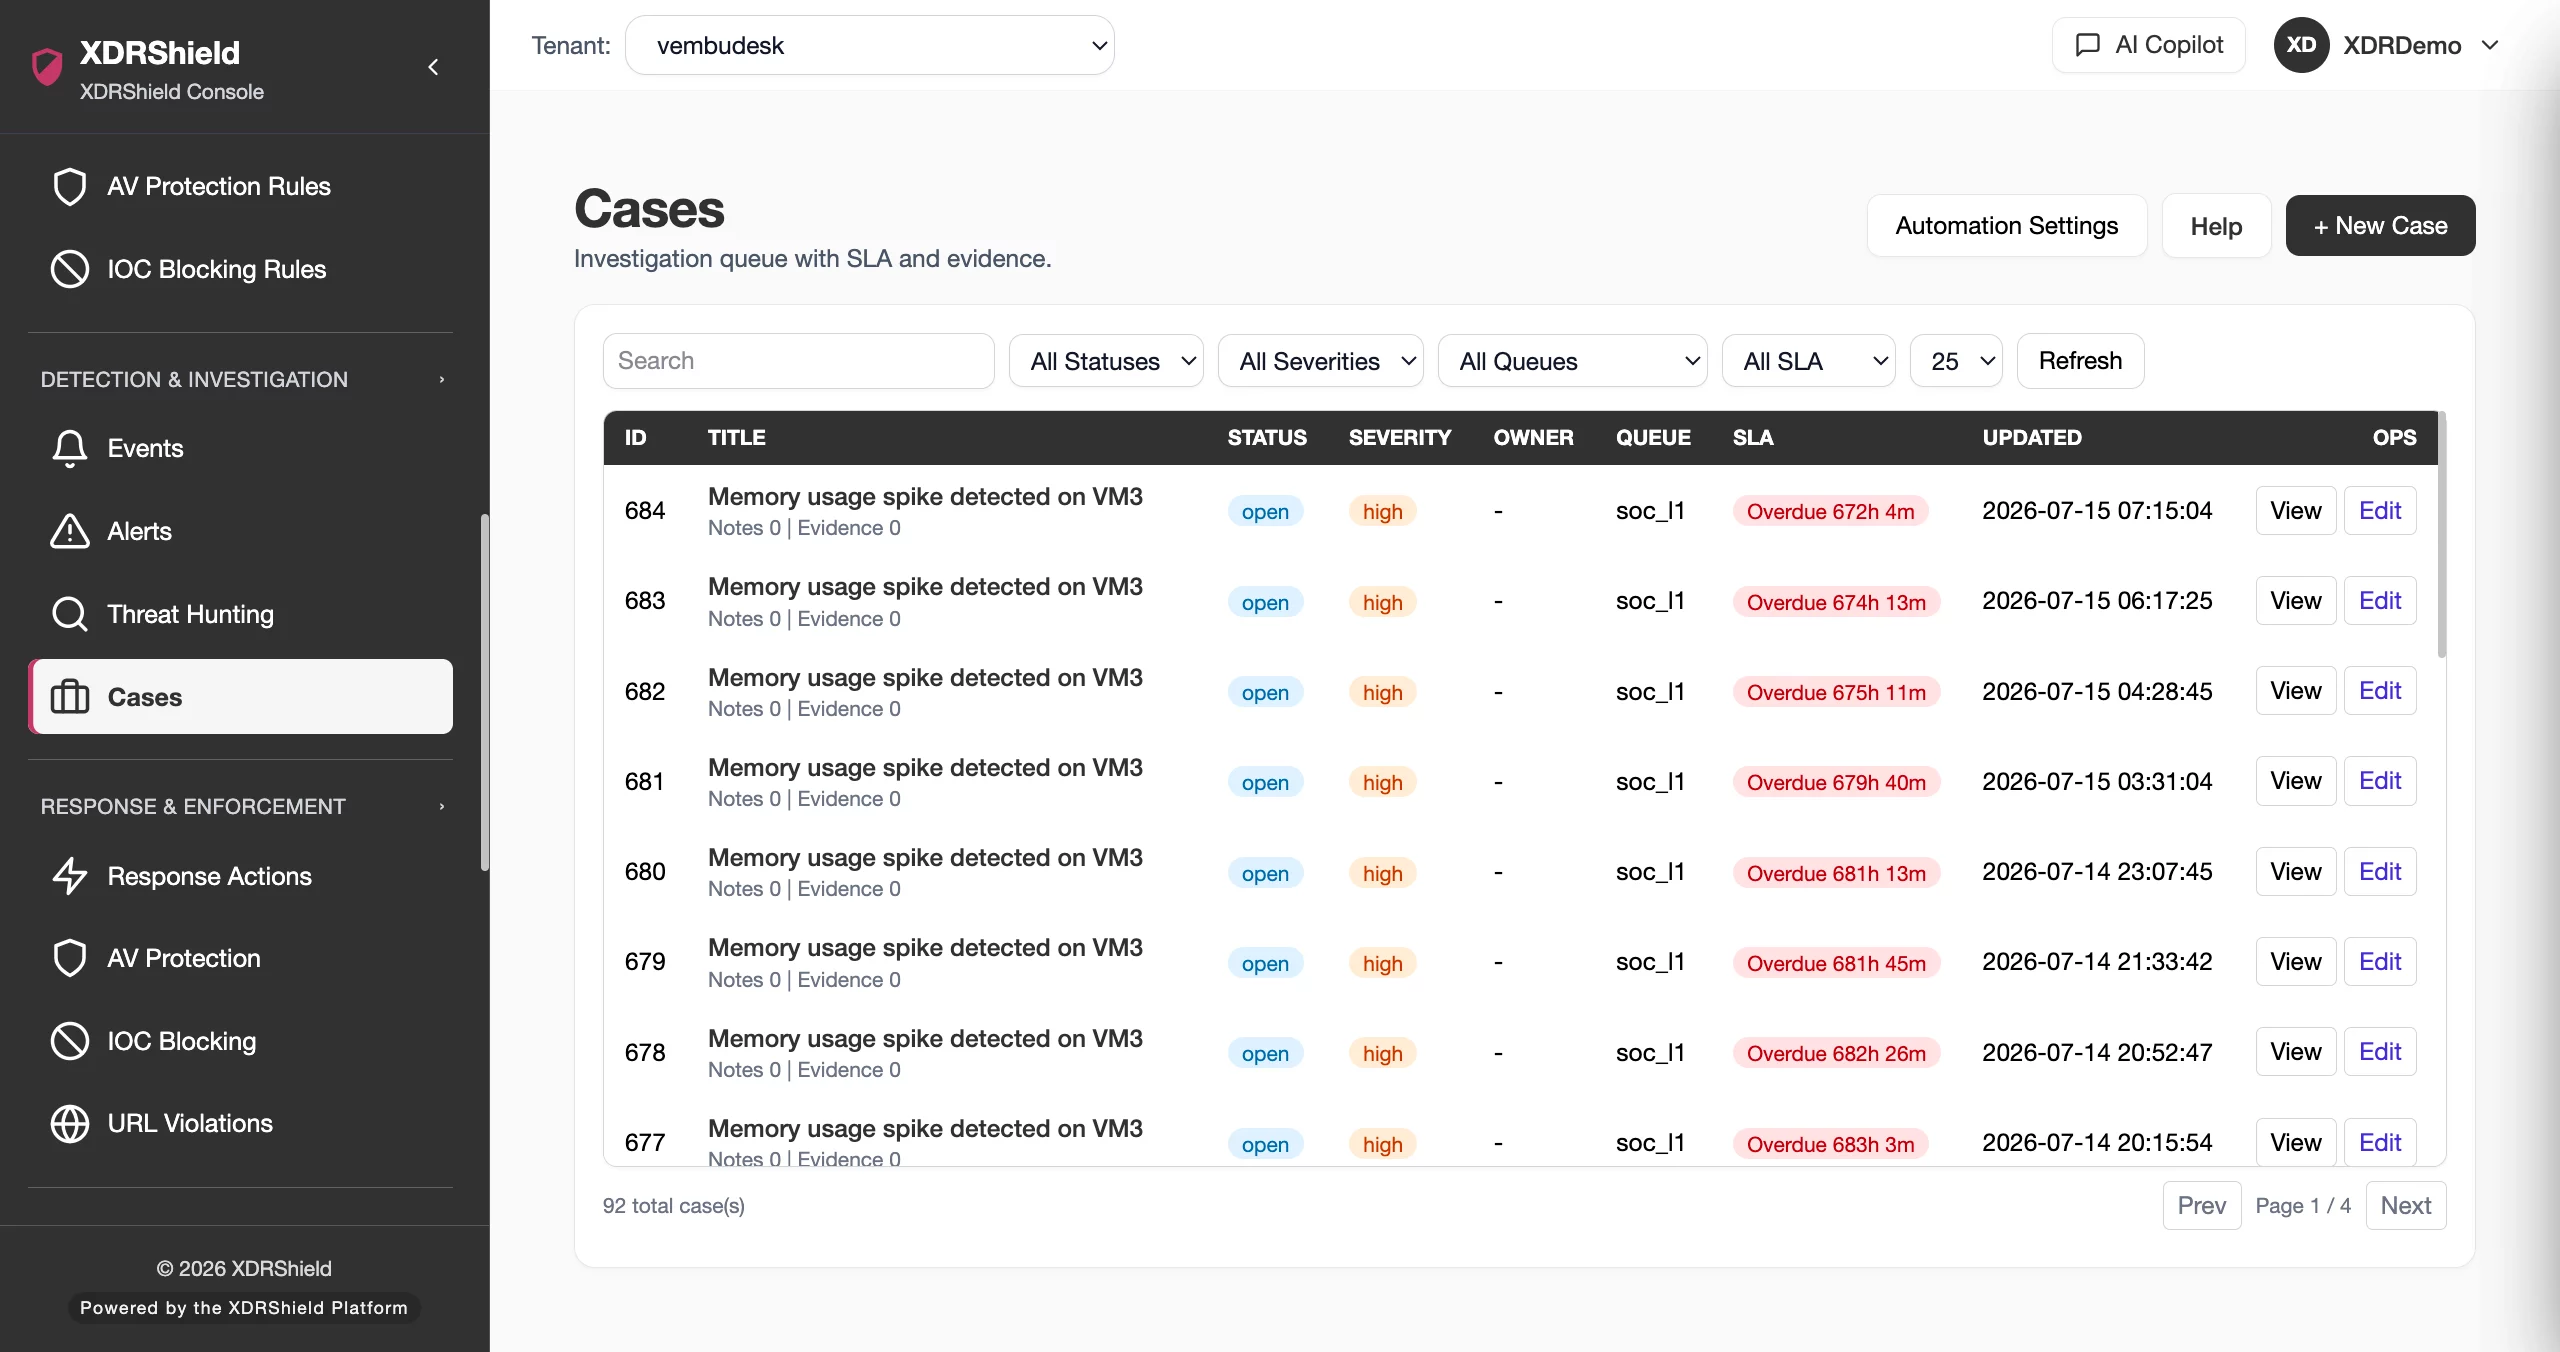
Metrics findings can be correlated with process activity, agent health, alerts, cases, and endpoint context.
How are metrics rules deployed?
Metrics rules are attached to policies and distributed to compatible agents within selected tenant scope.
How can MSP teams use metrics rules?
MSP teams can apply customer-specific metrics monitoring policies and review endpoint health signals by tenant.
Monitor resource signals with context
Use metrics rules to find unhealthy or suspicious endpoints.