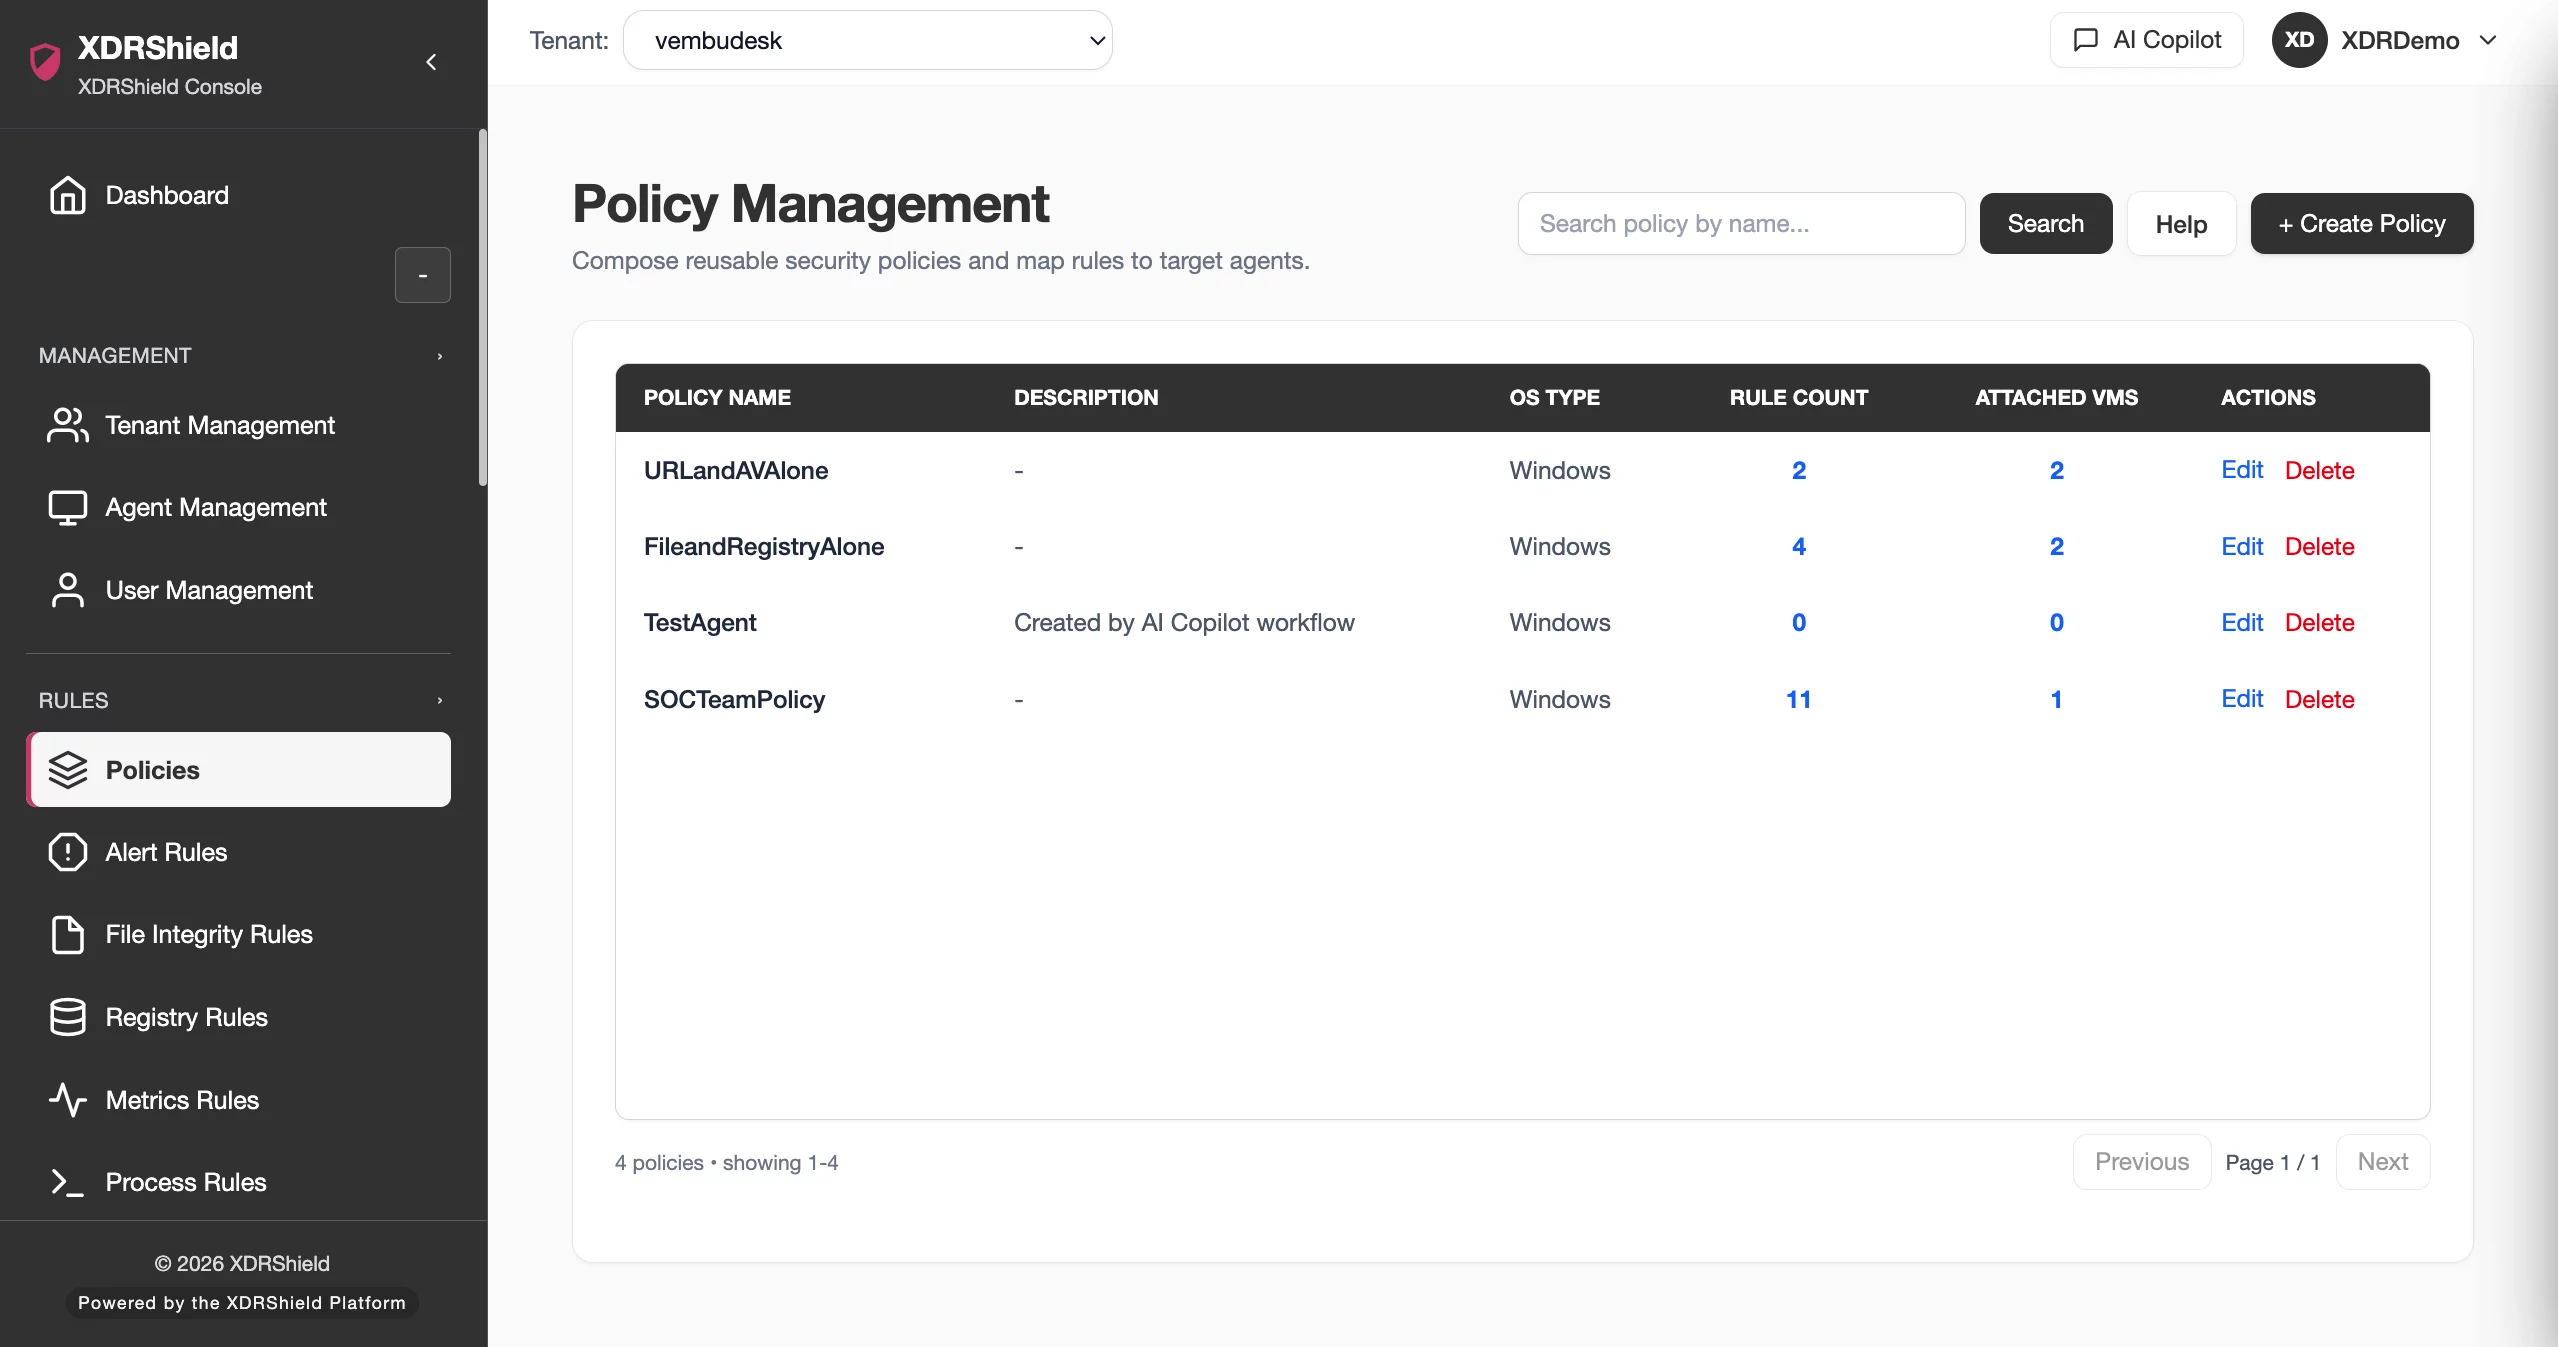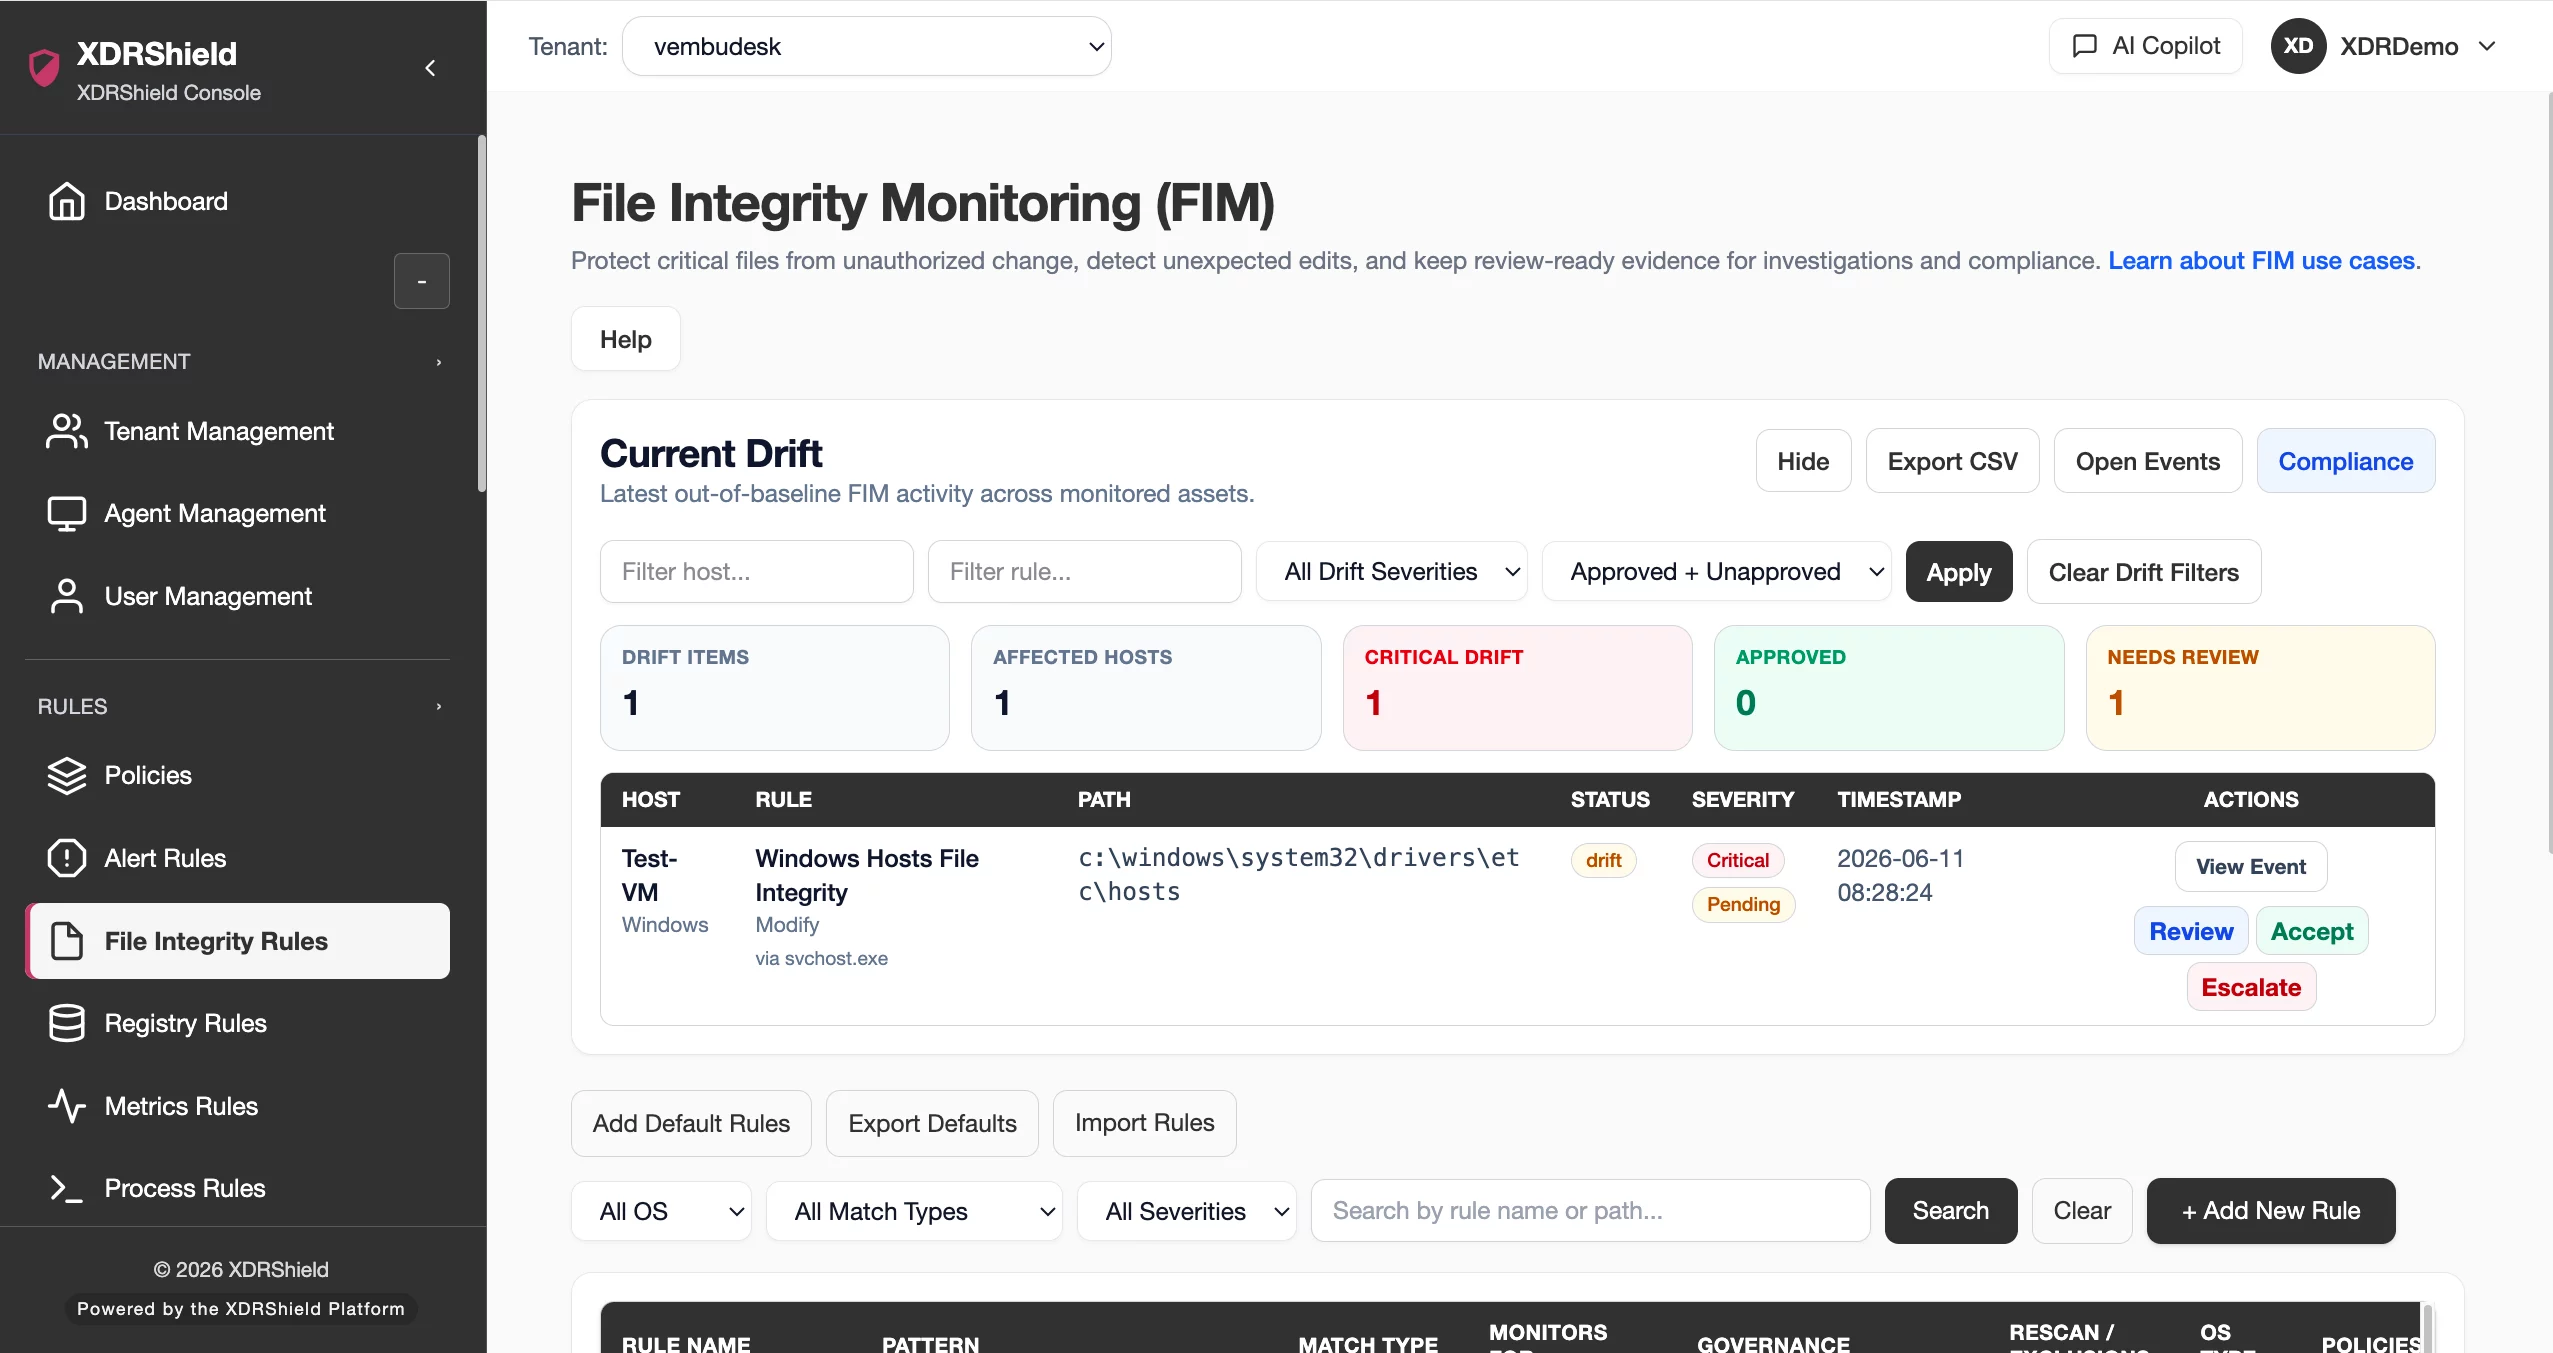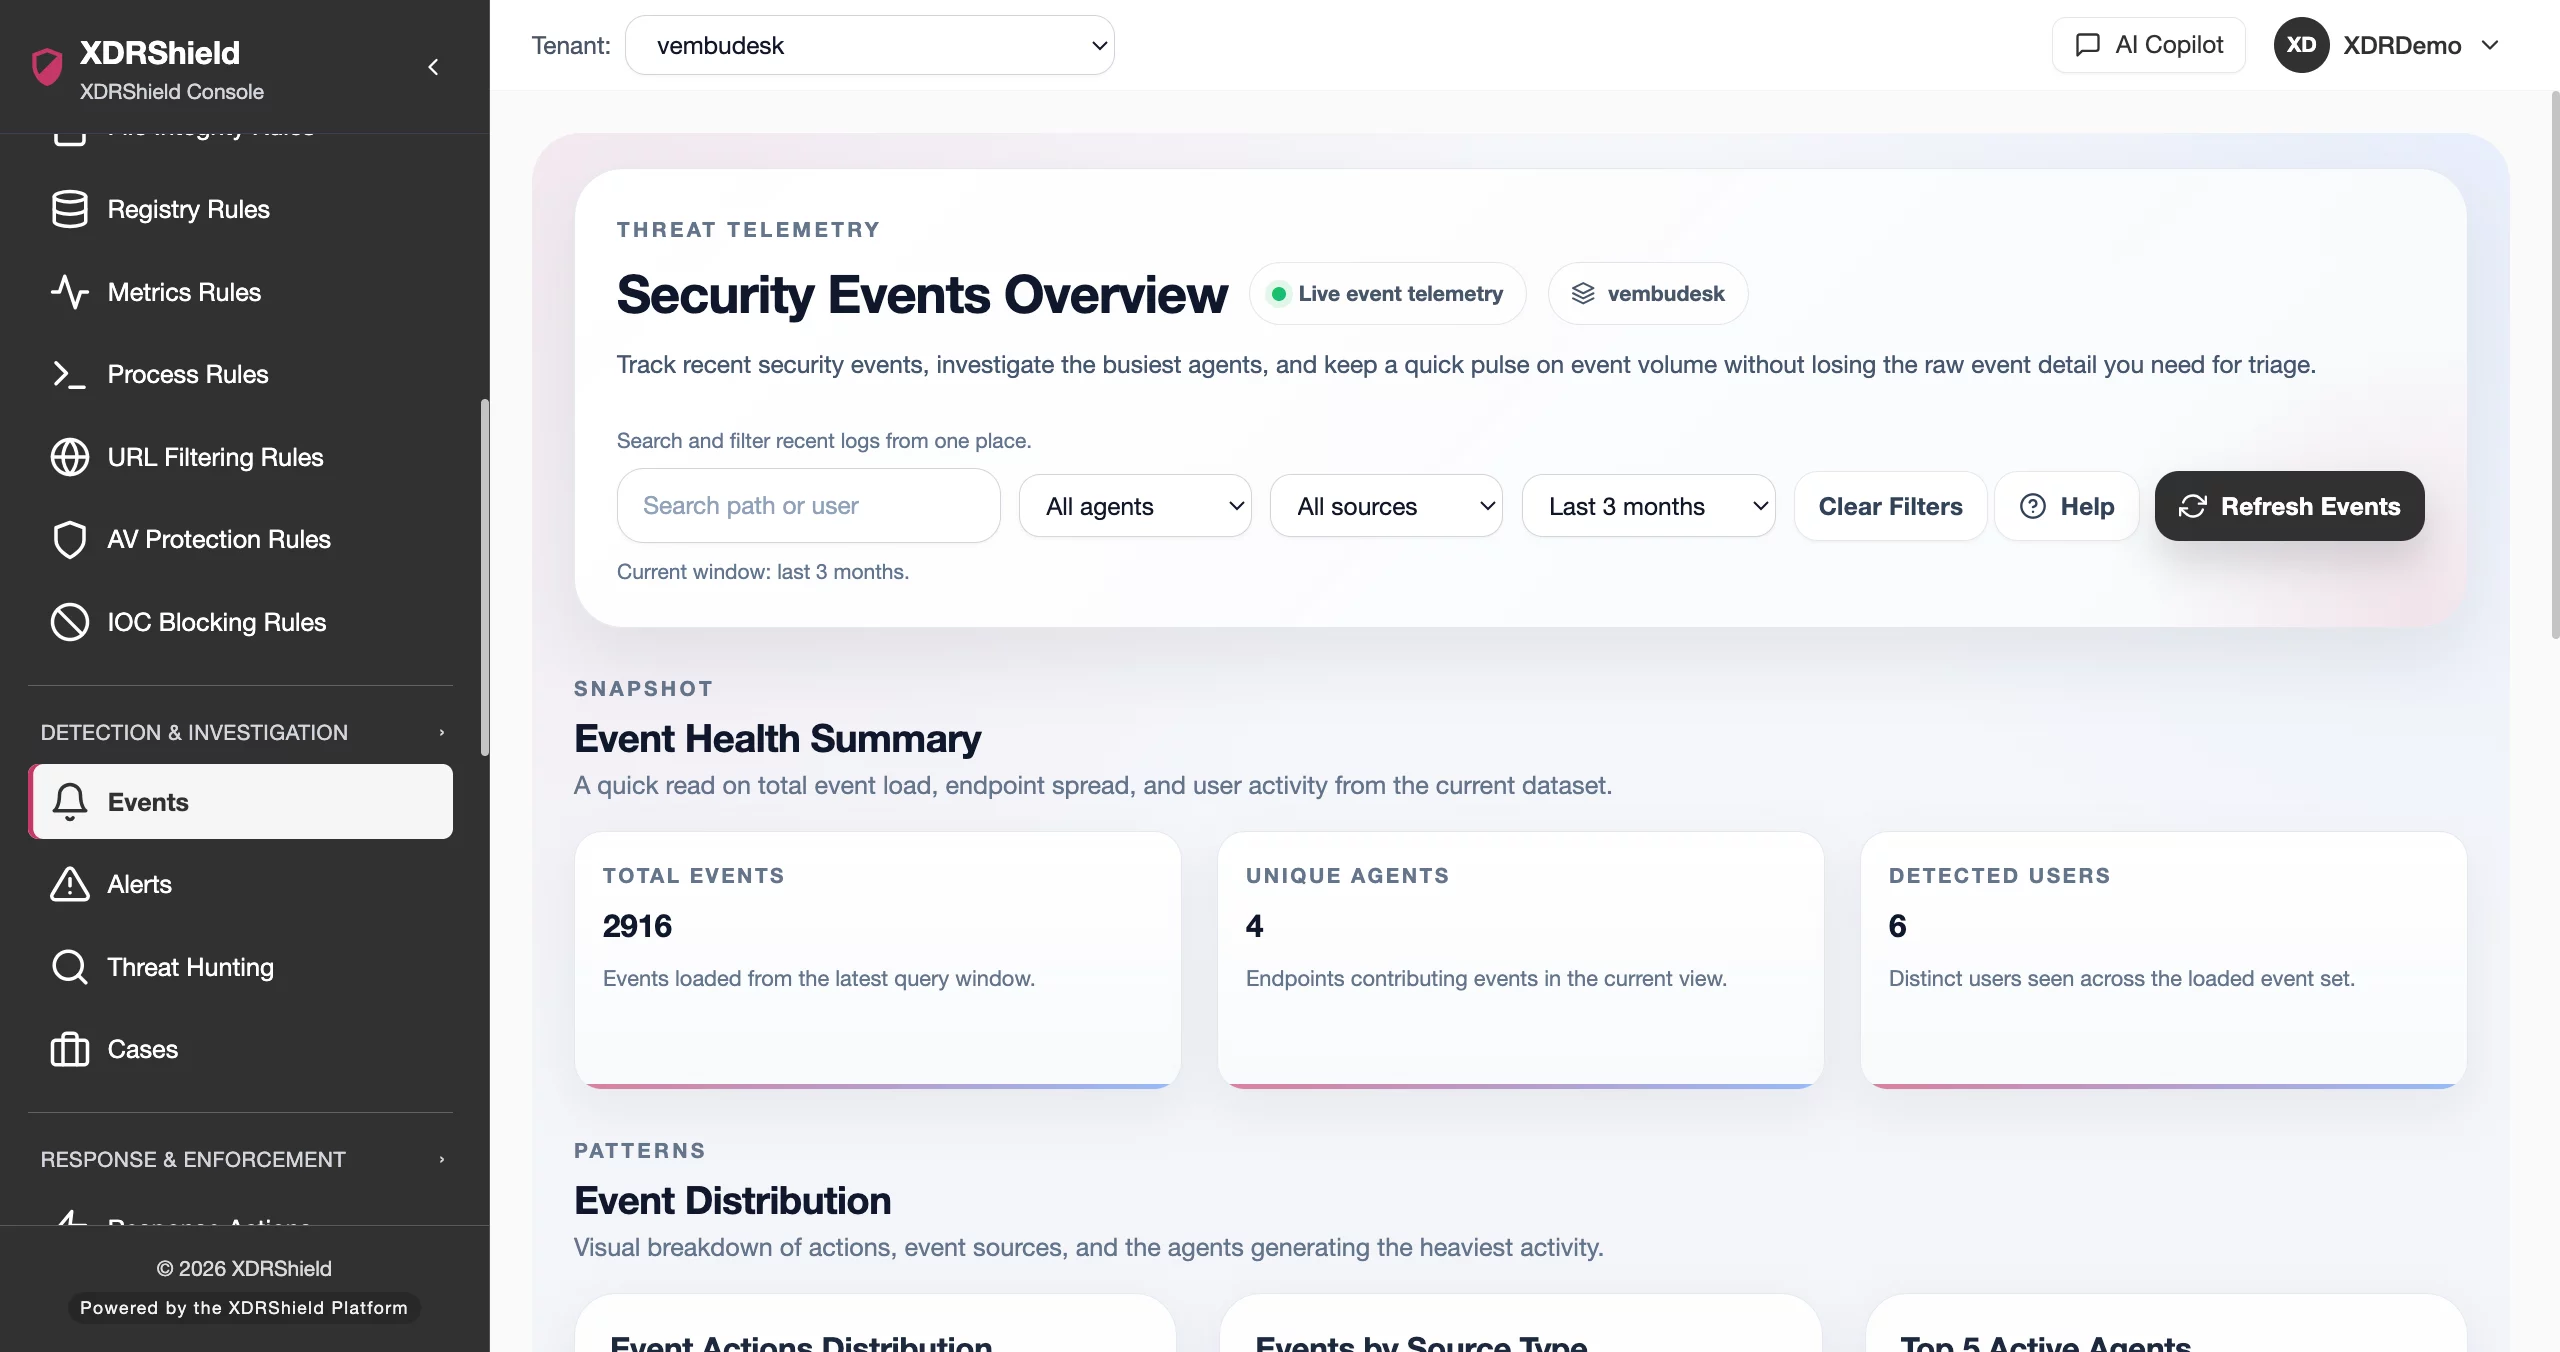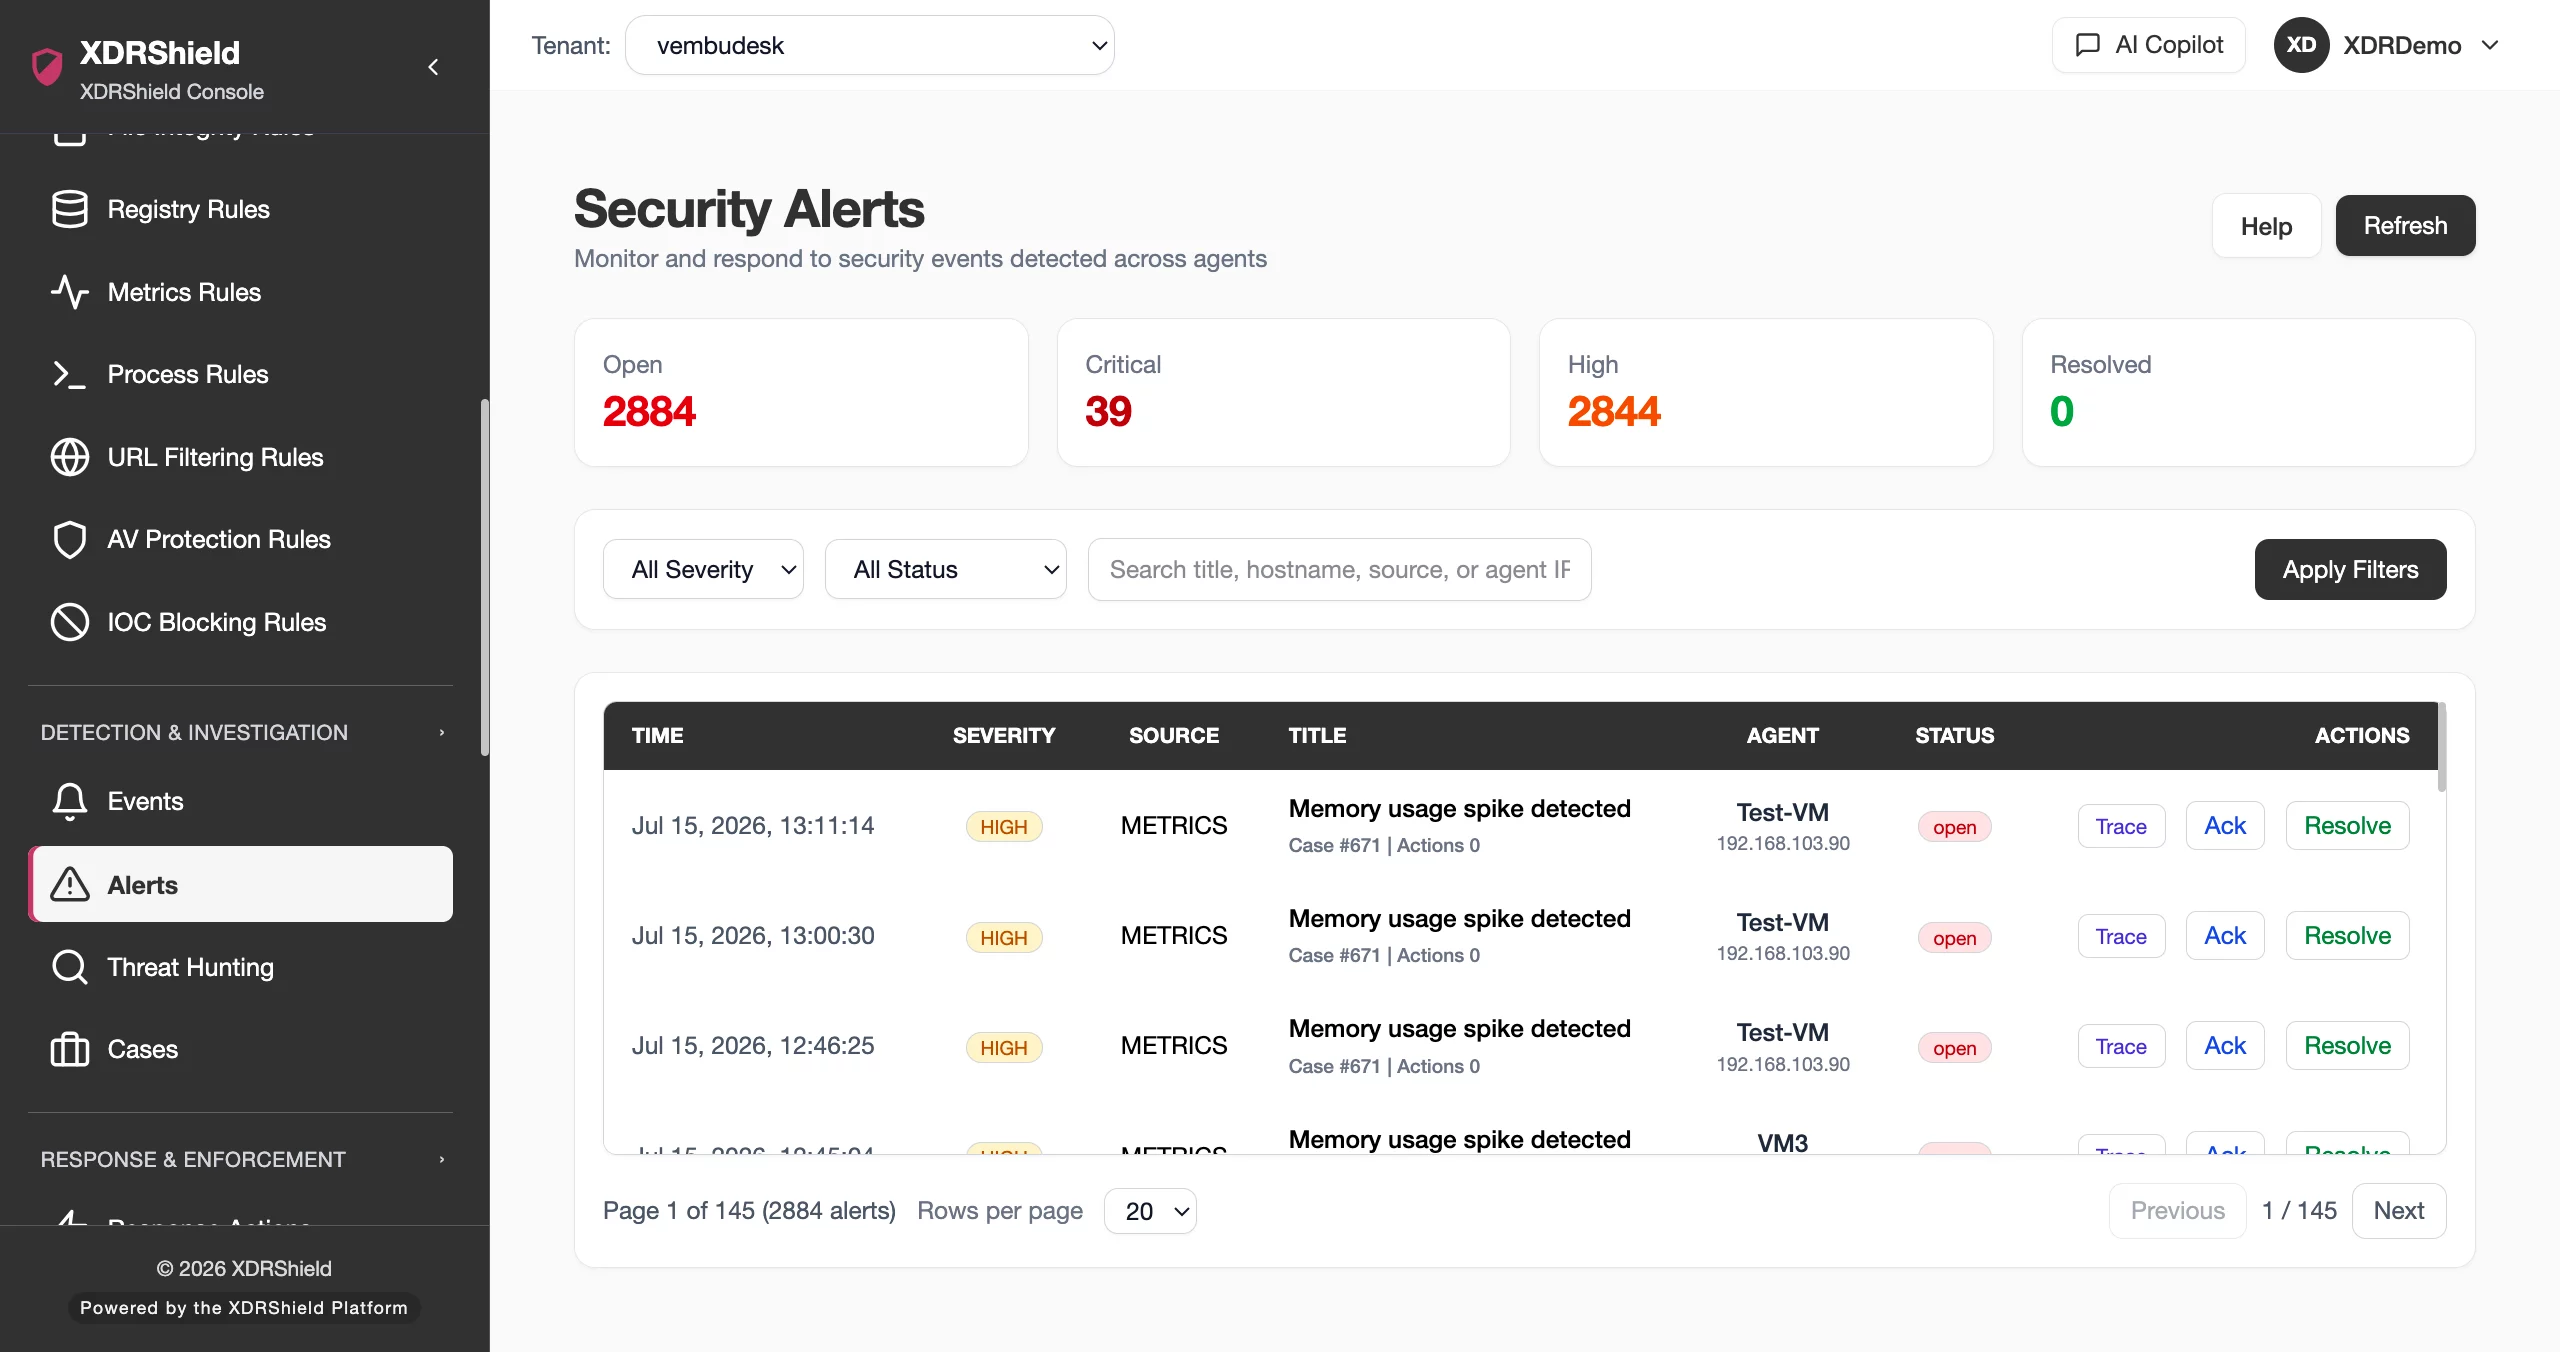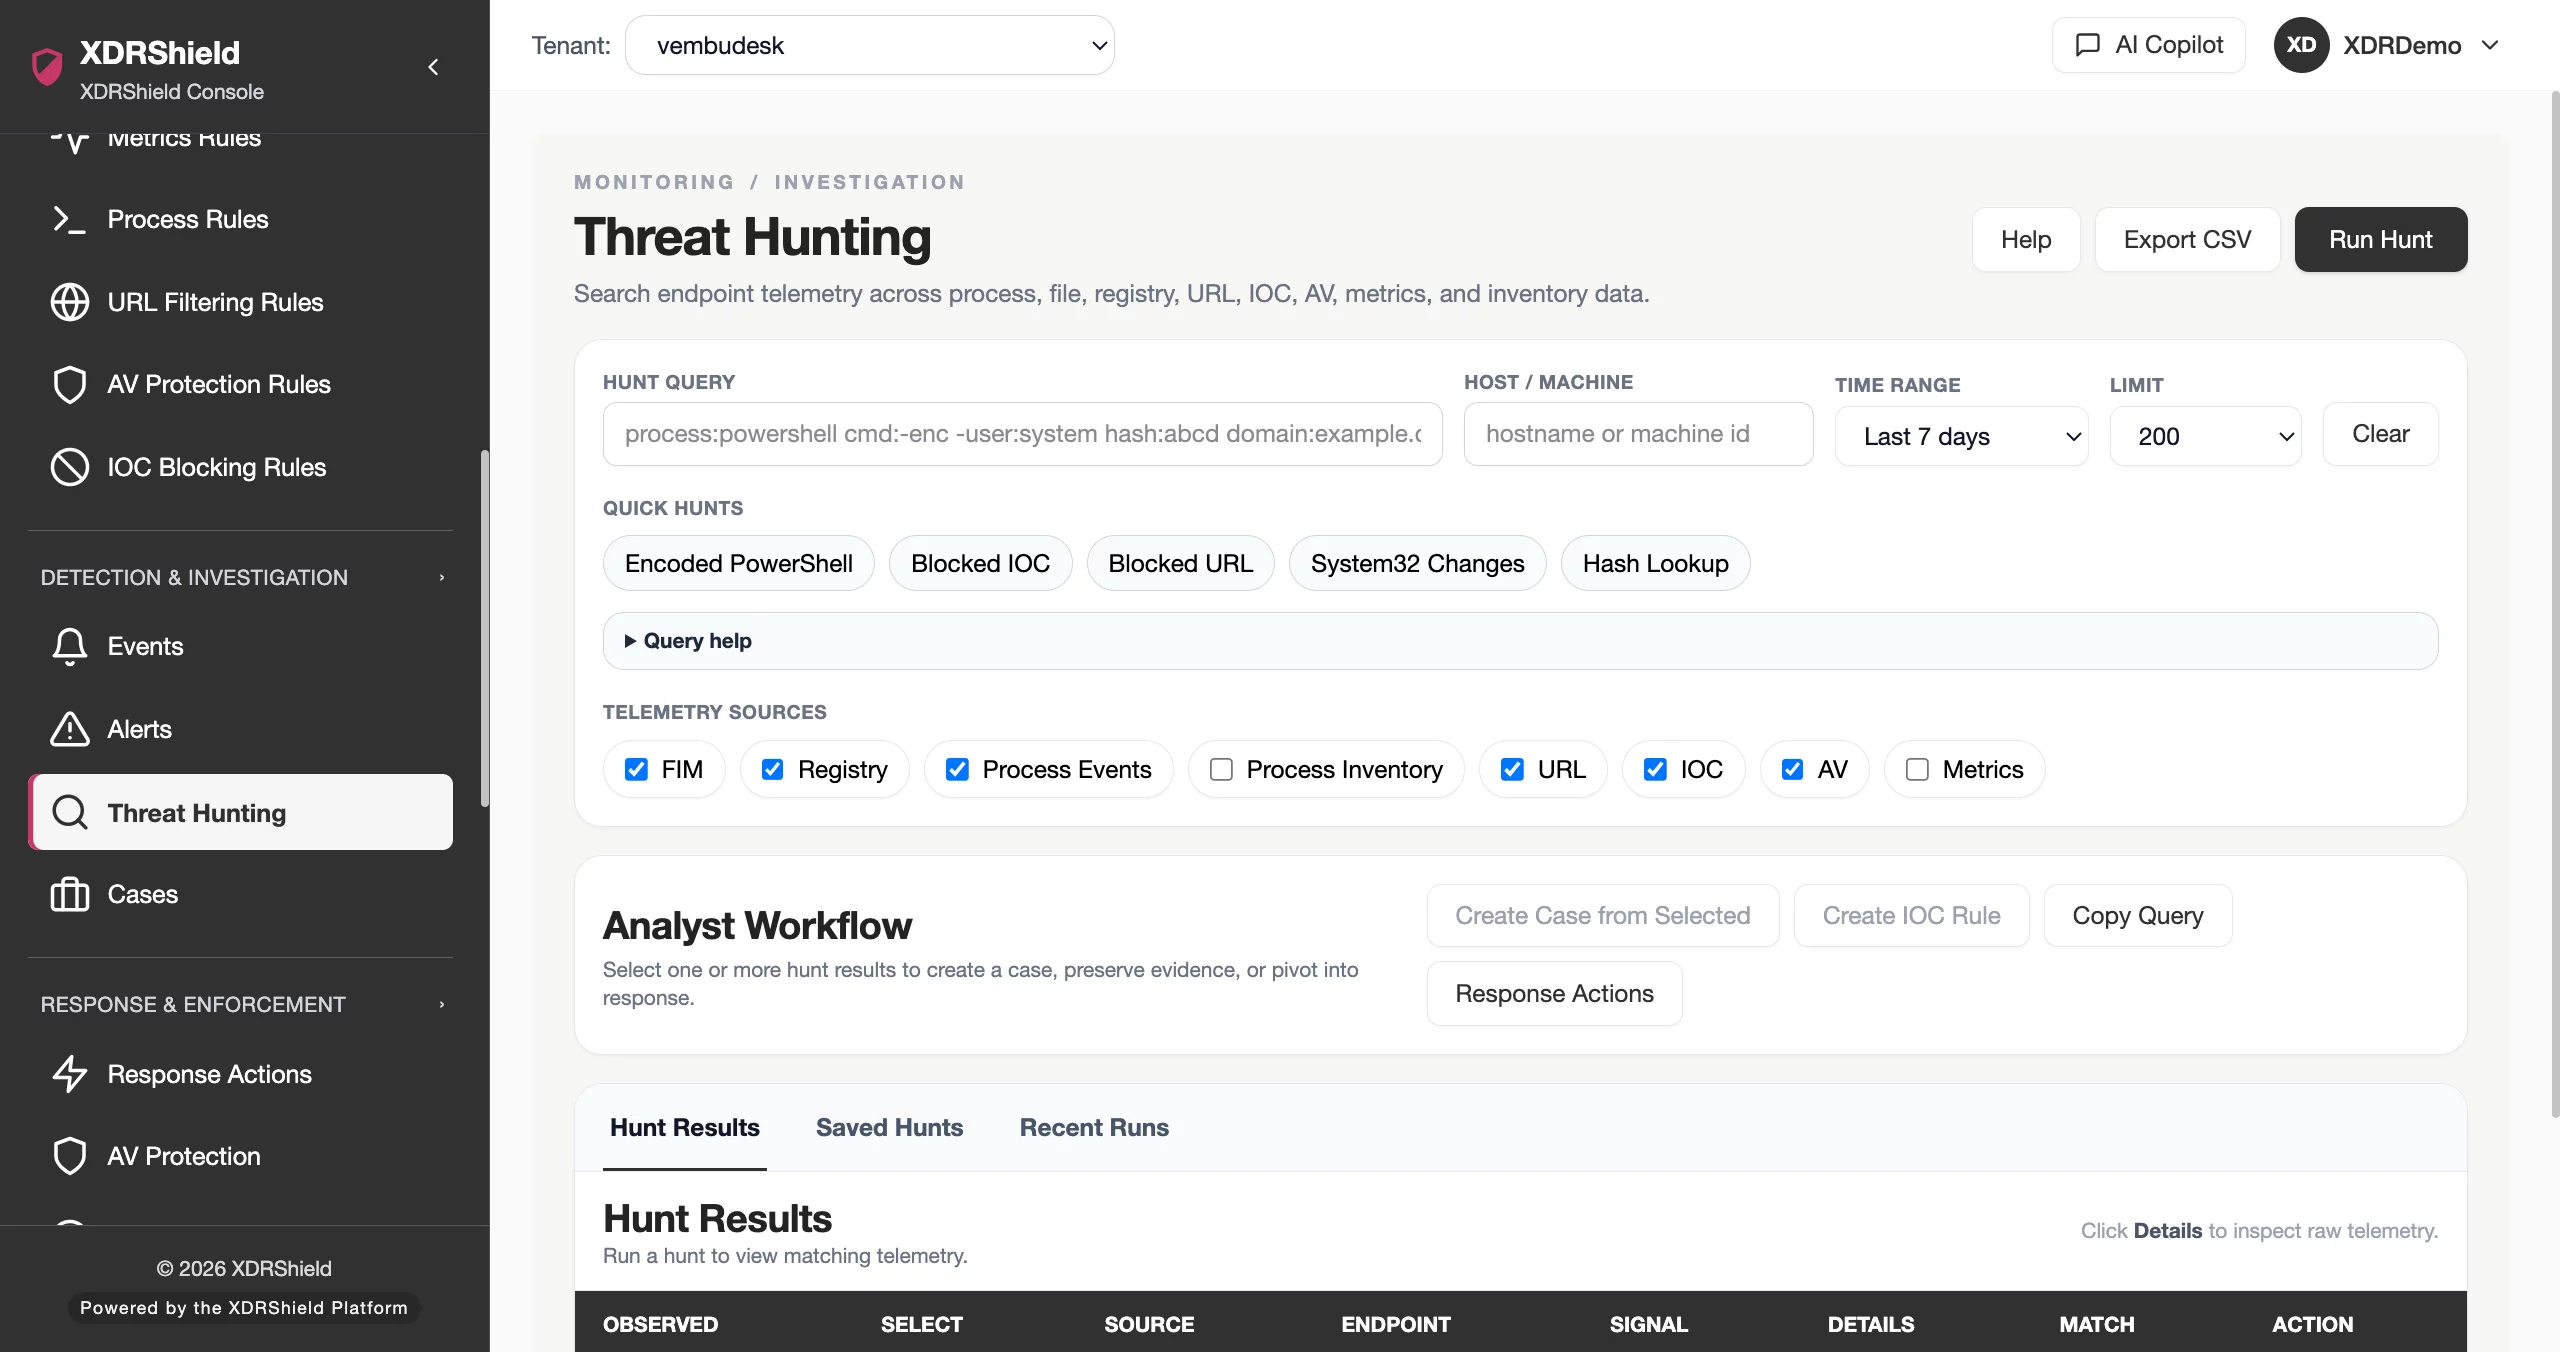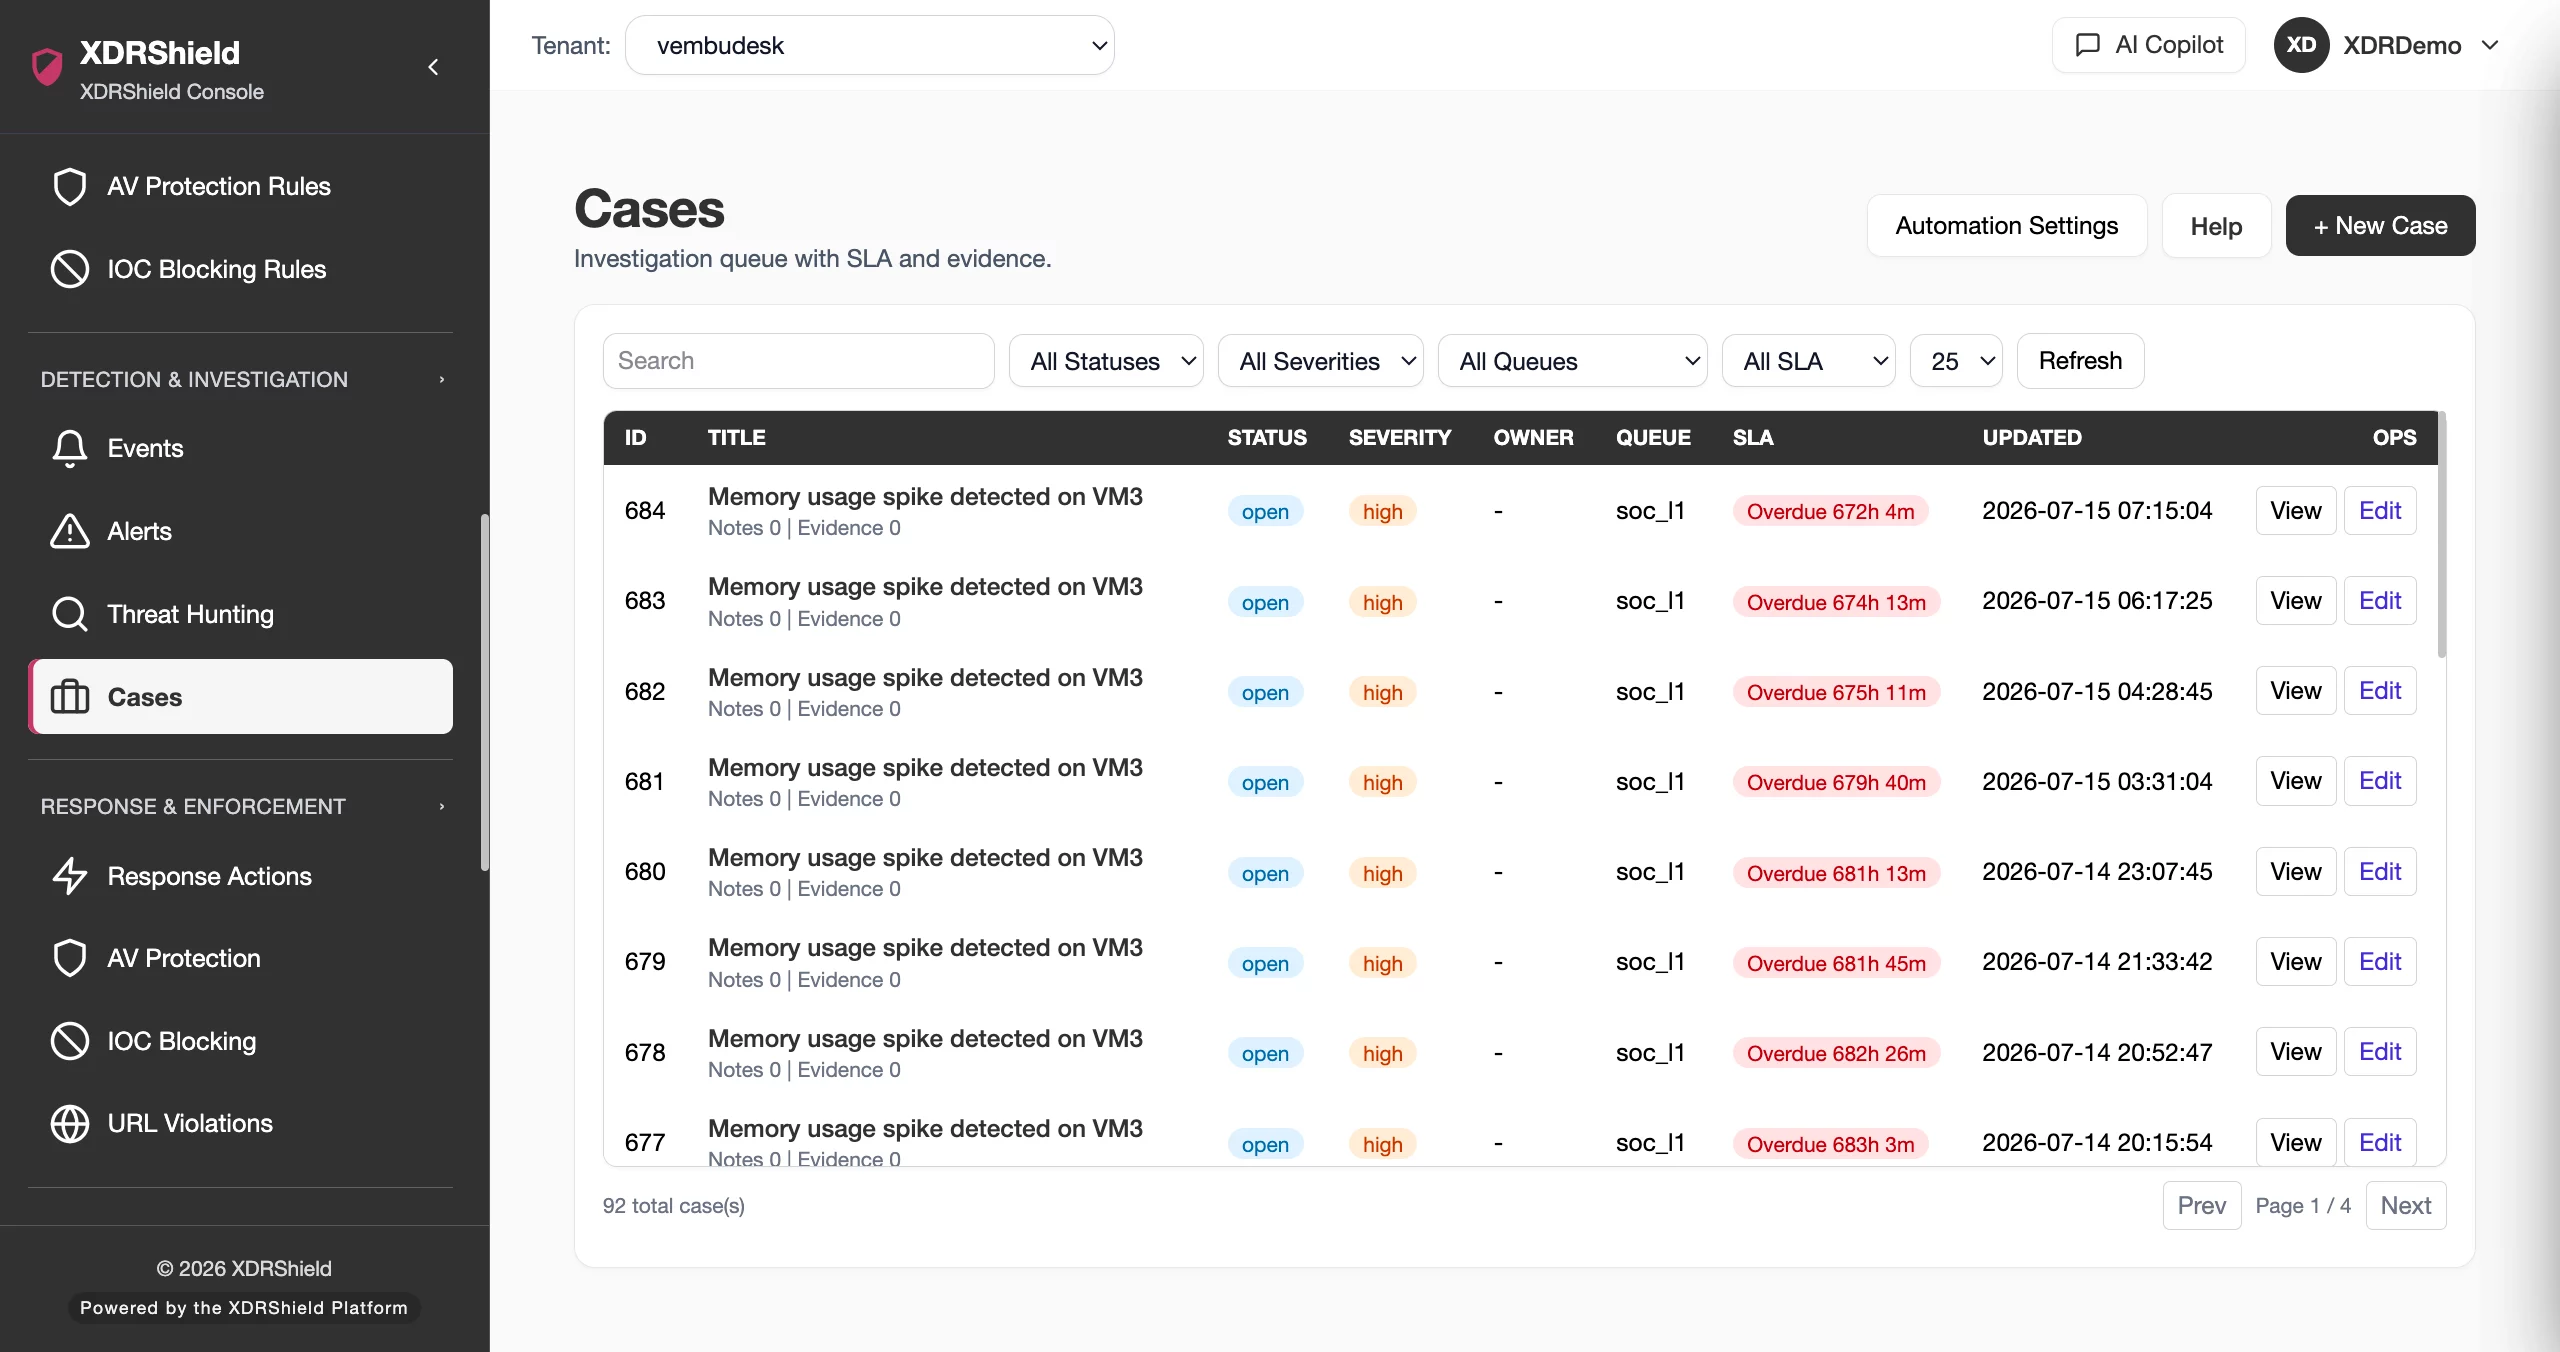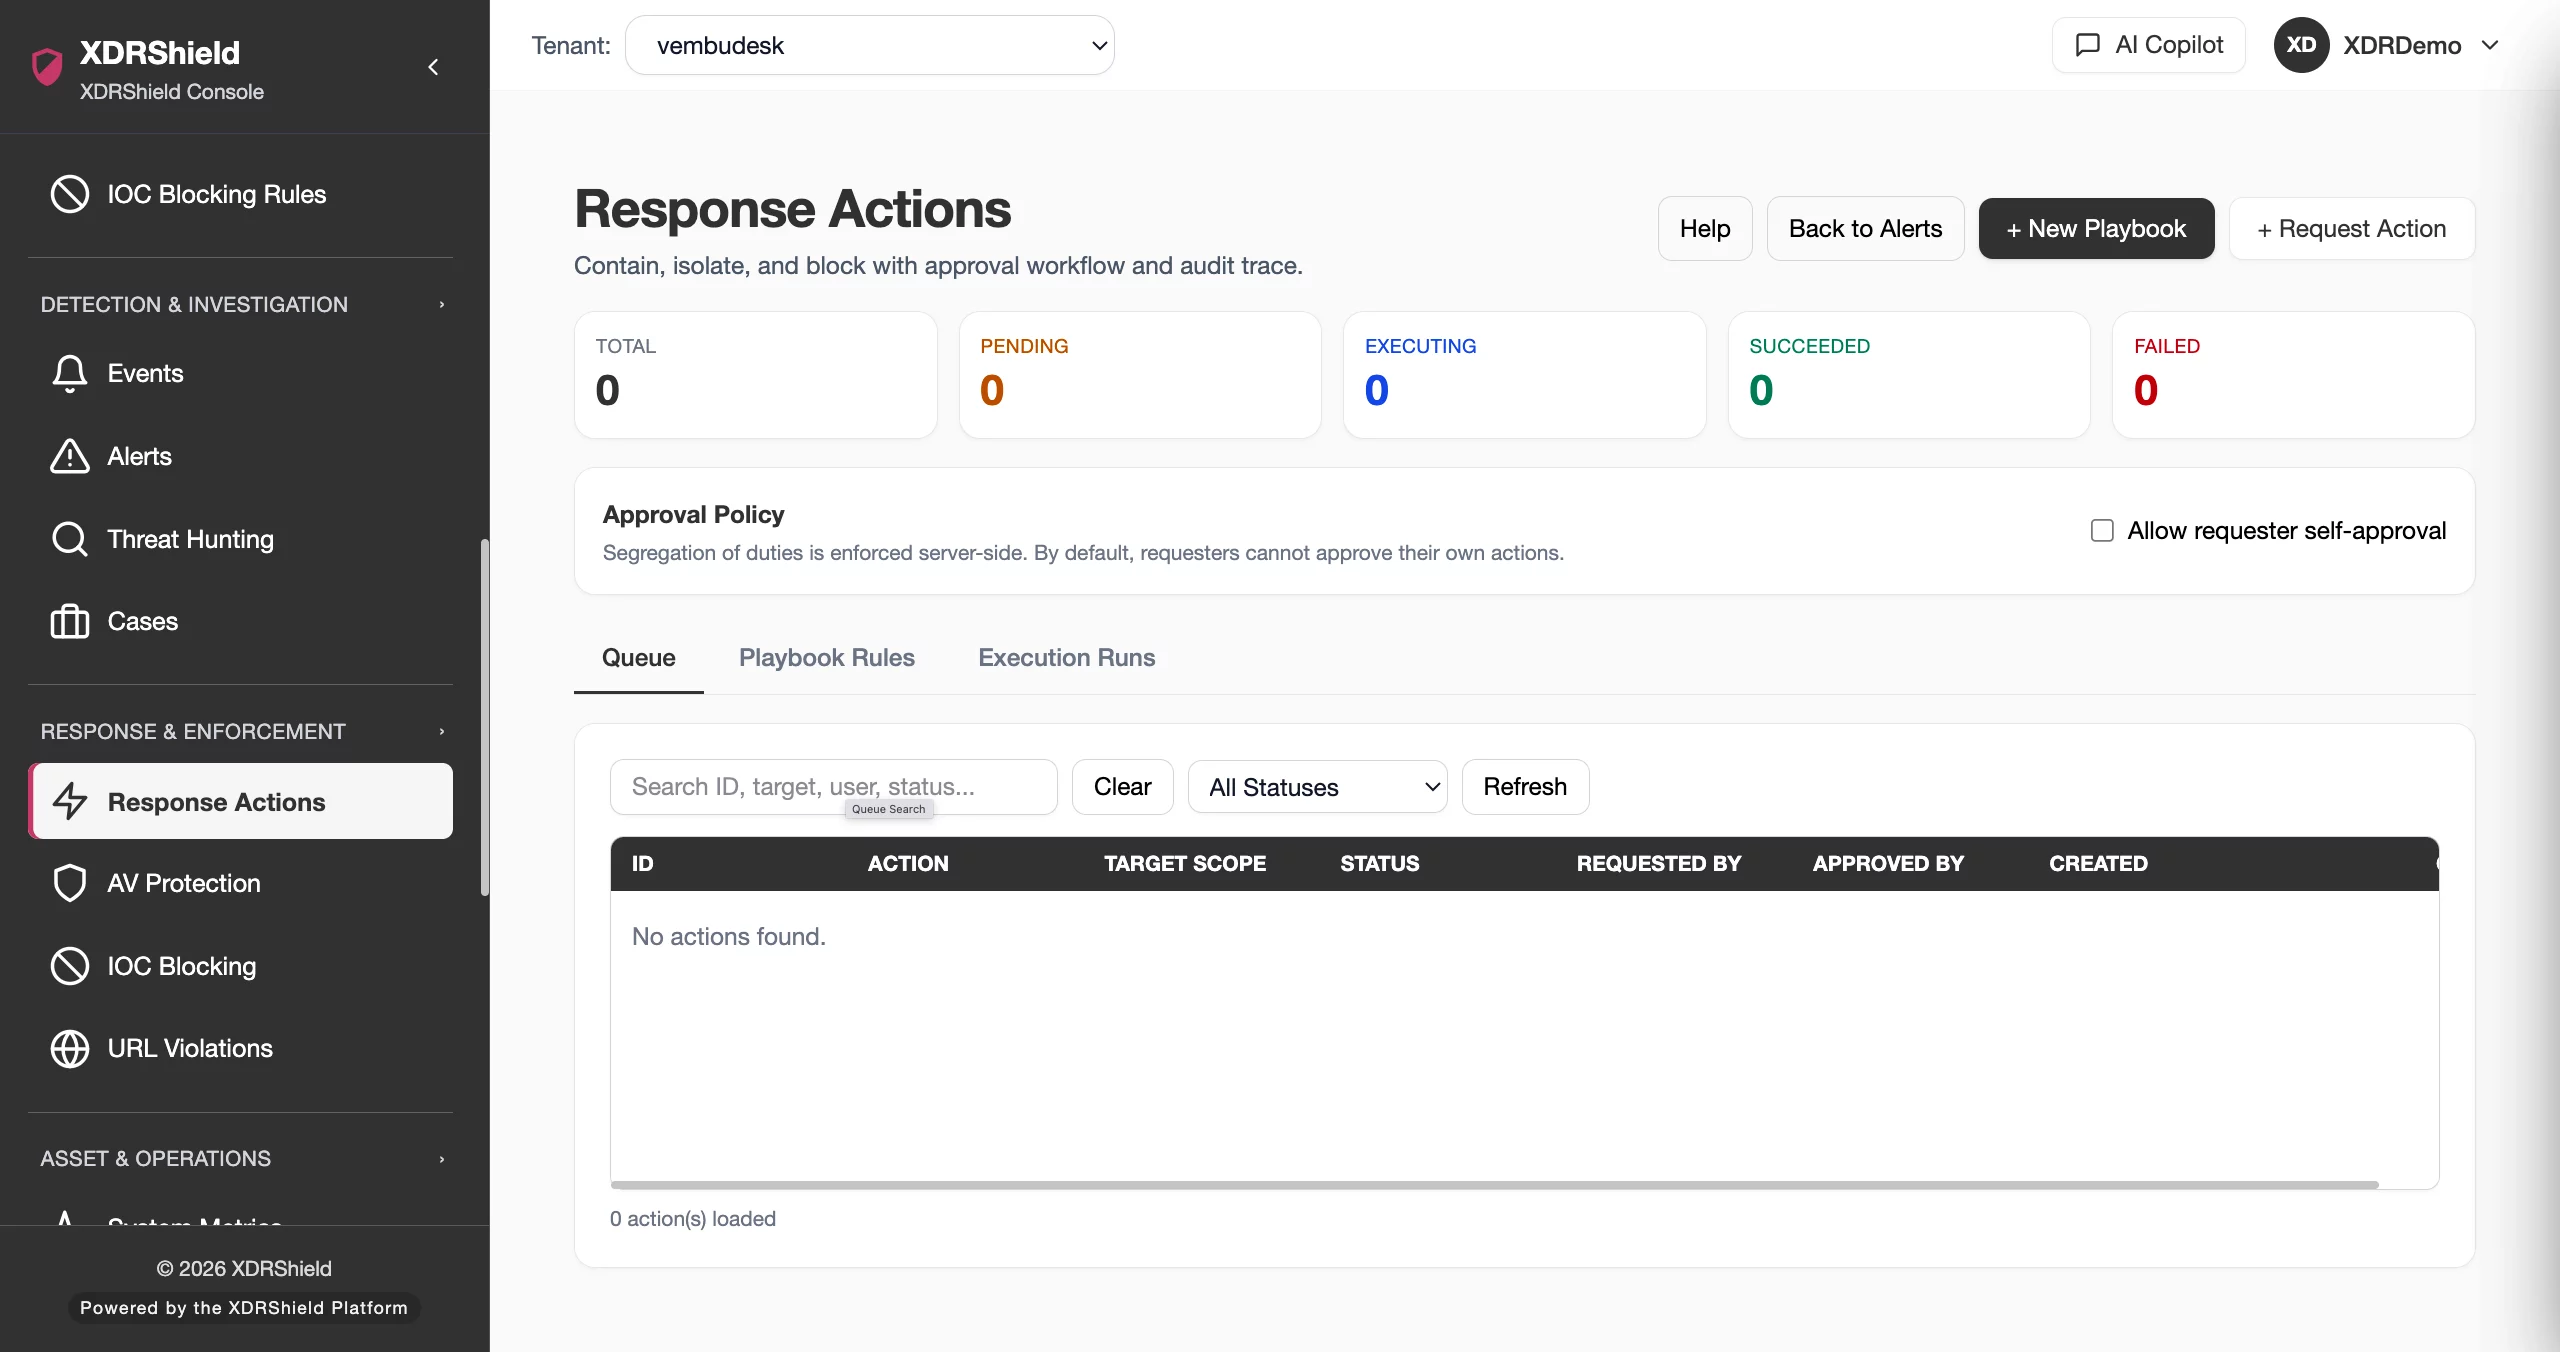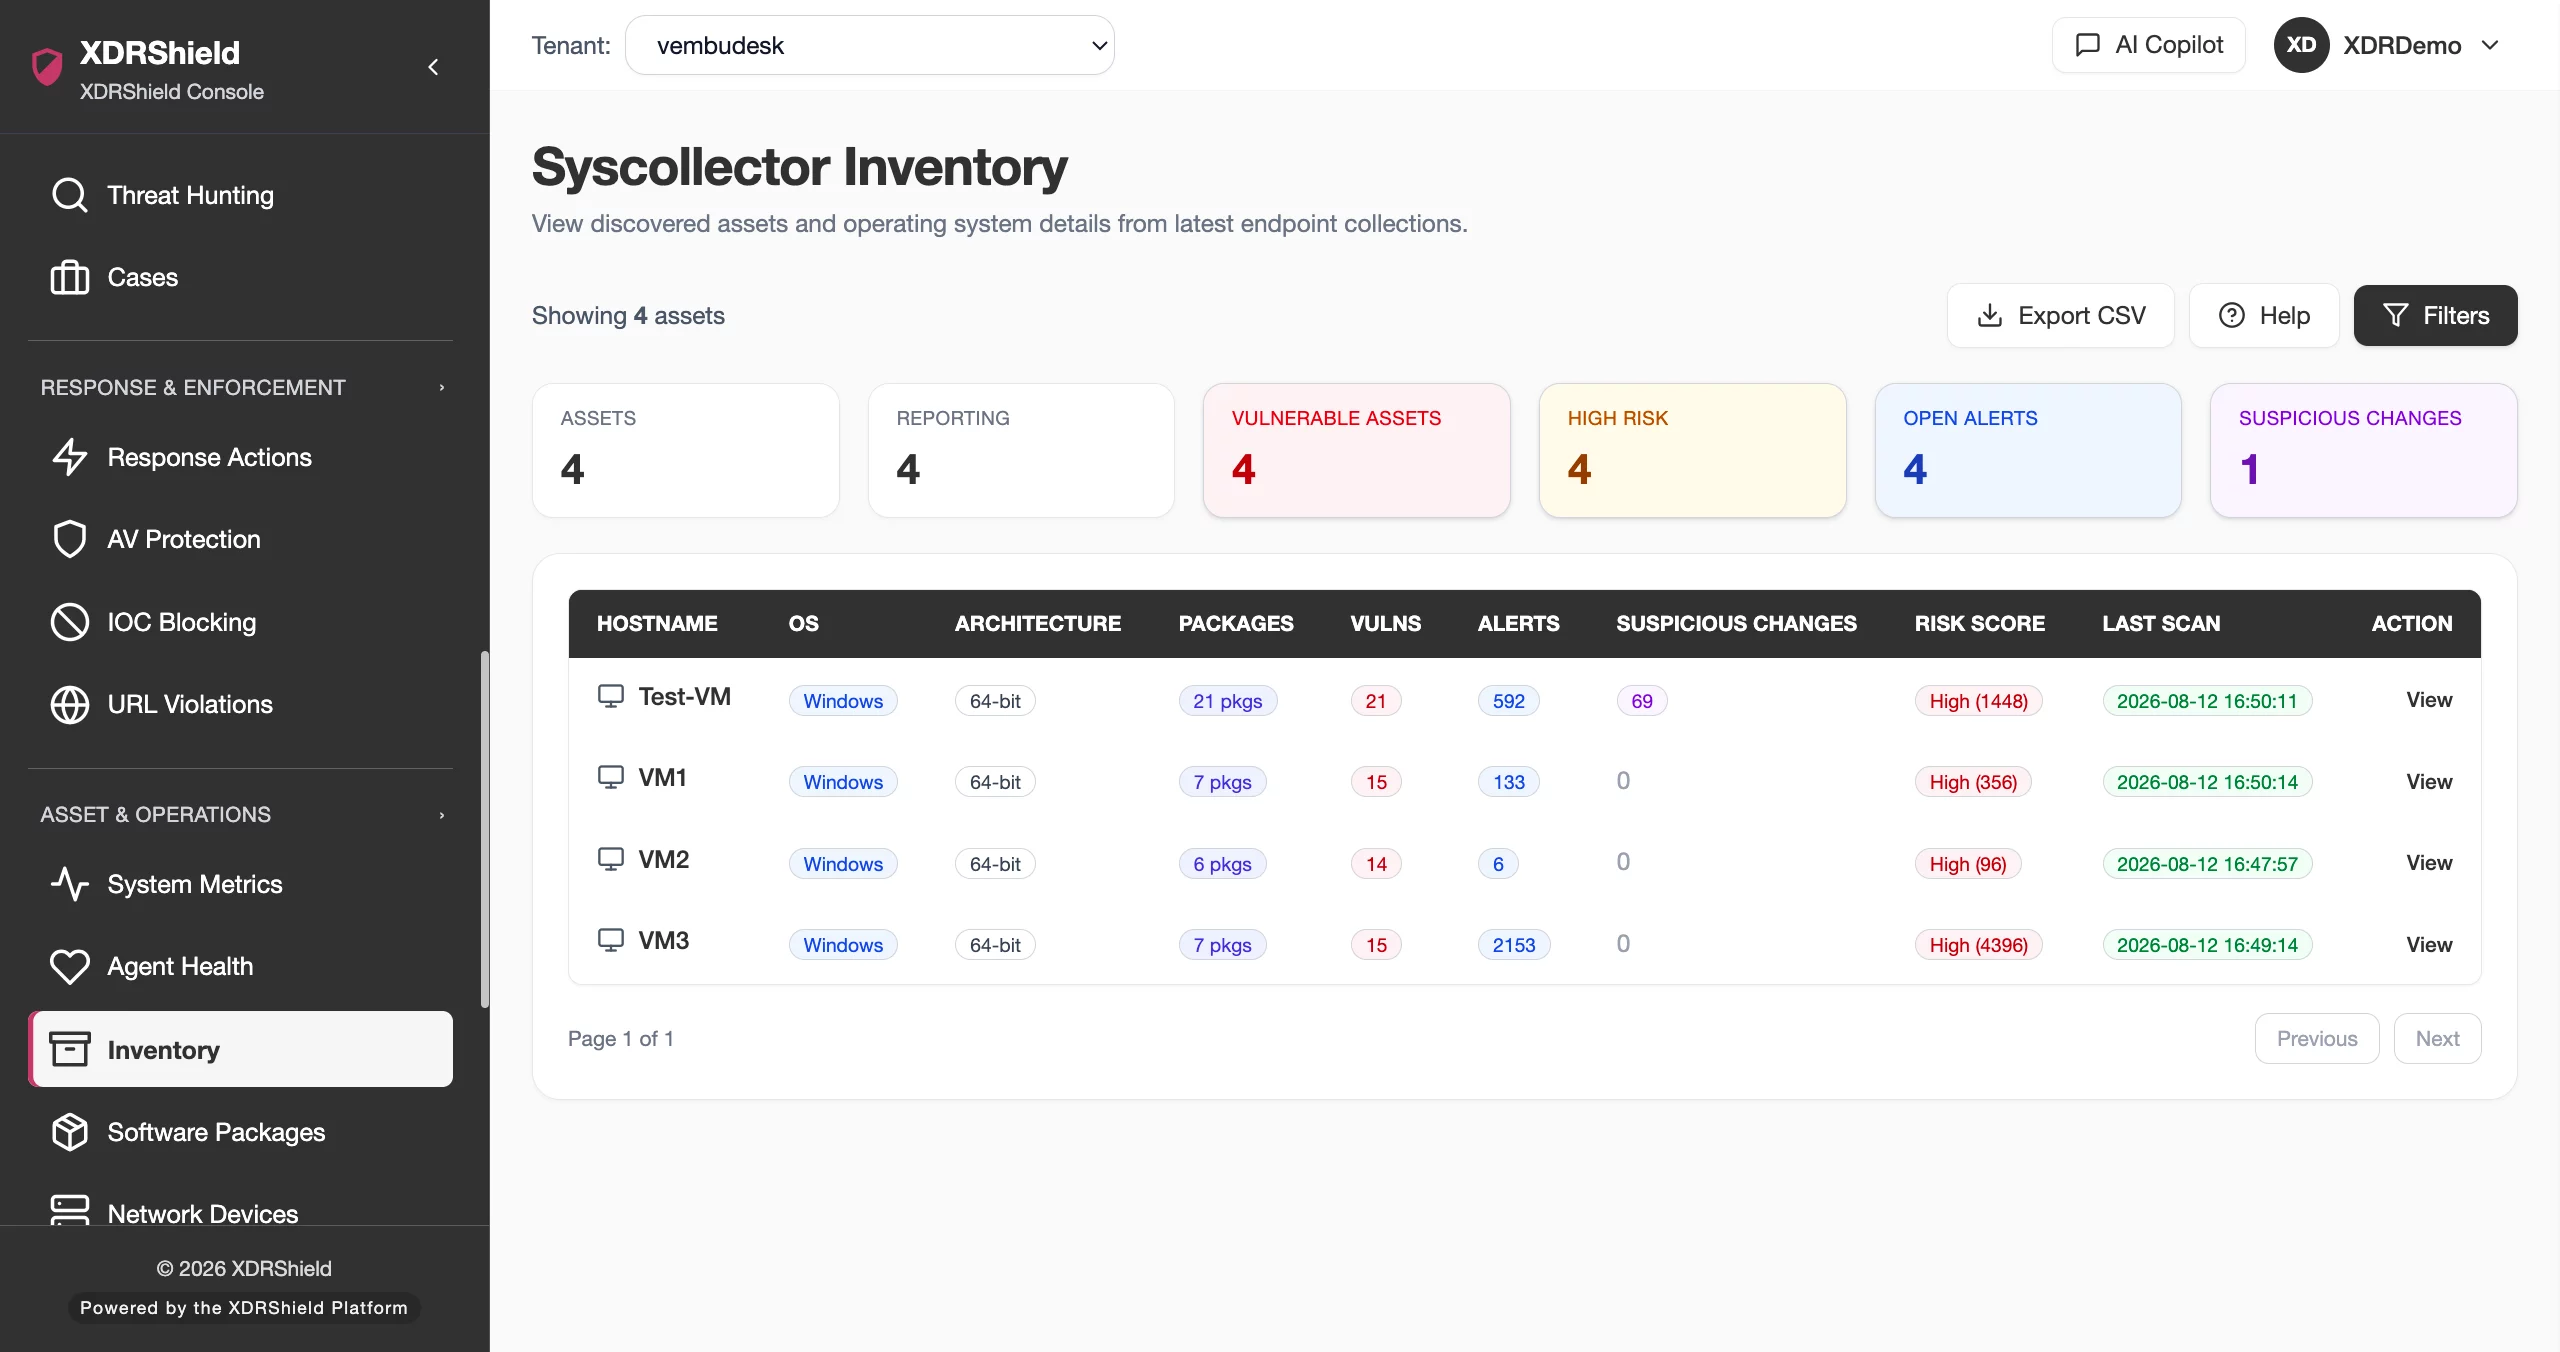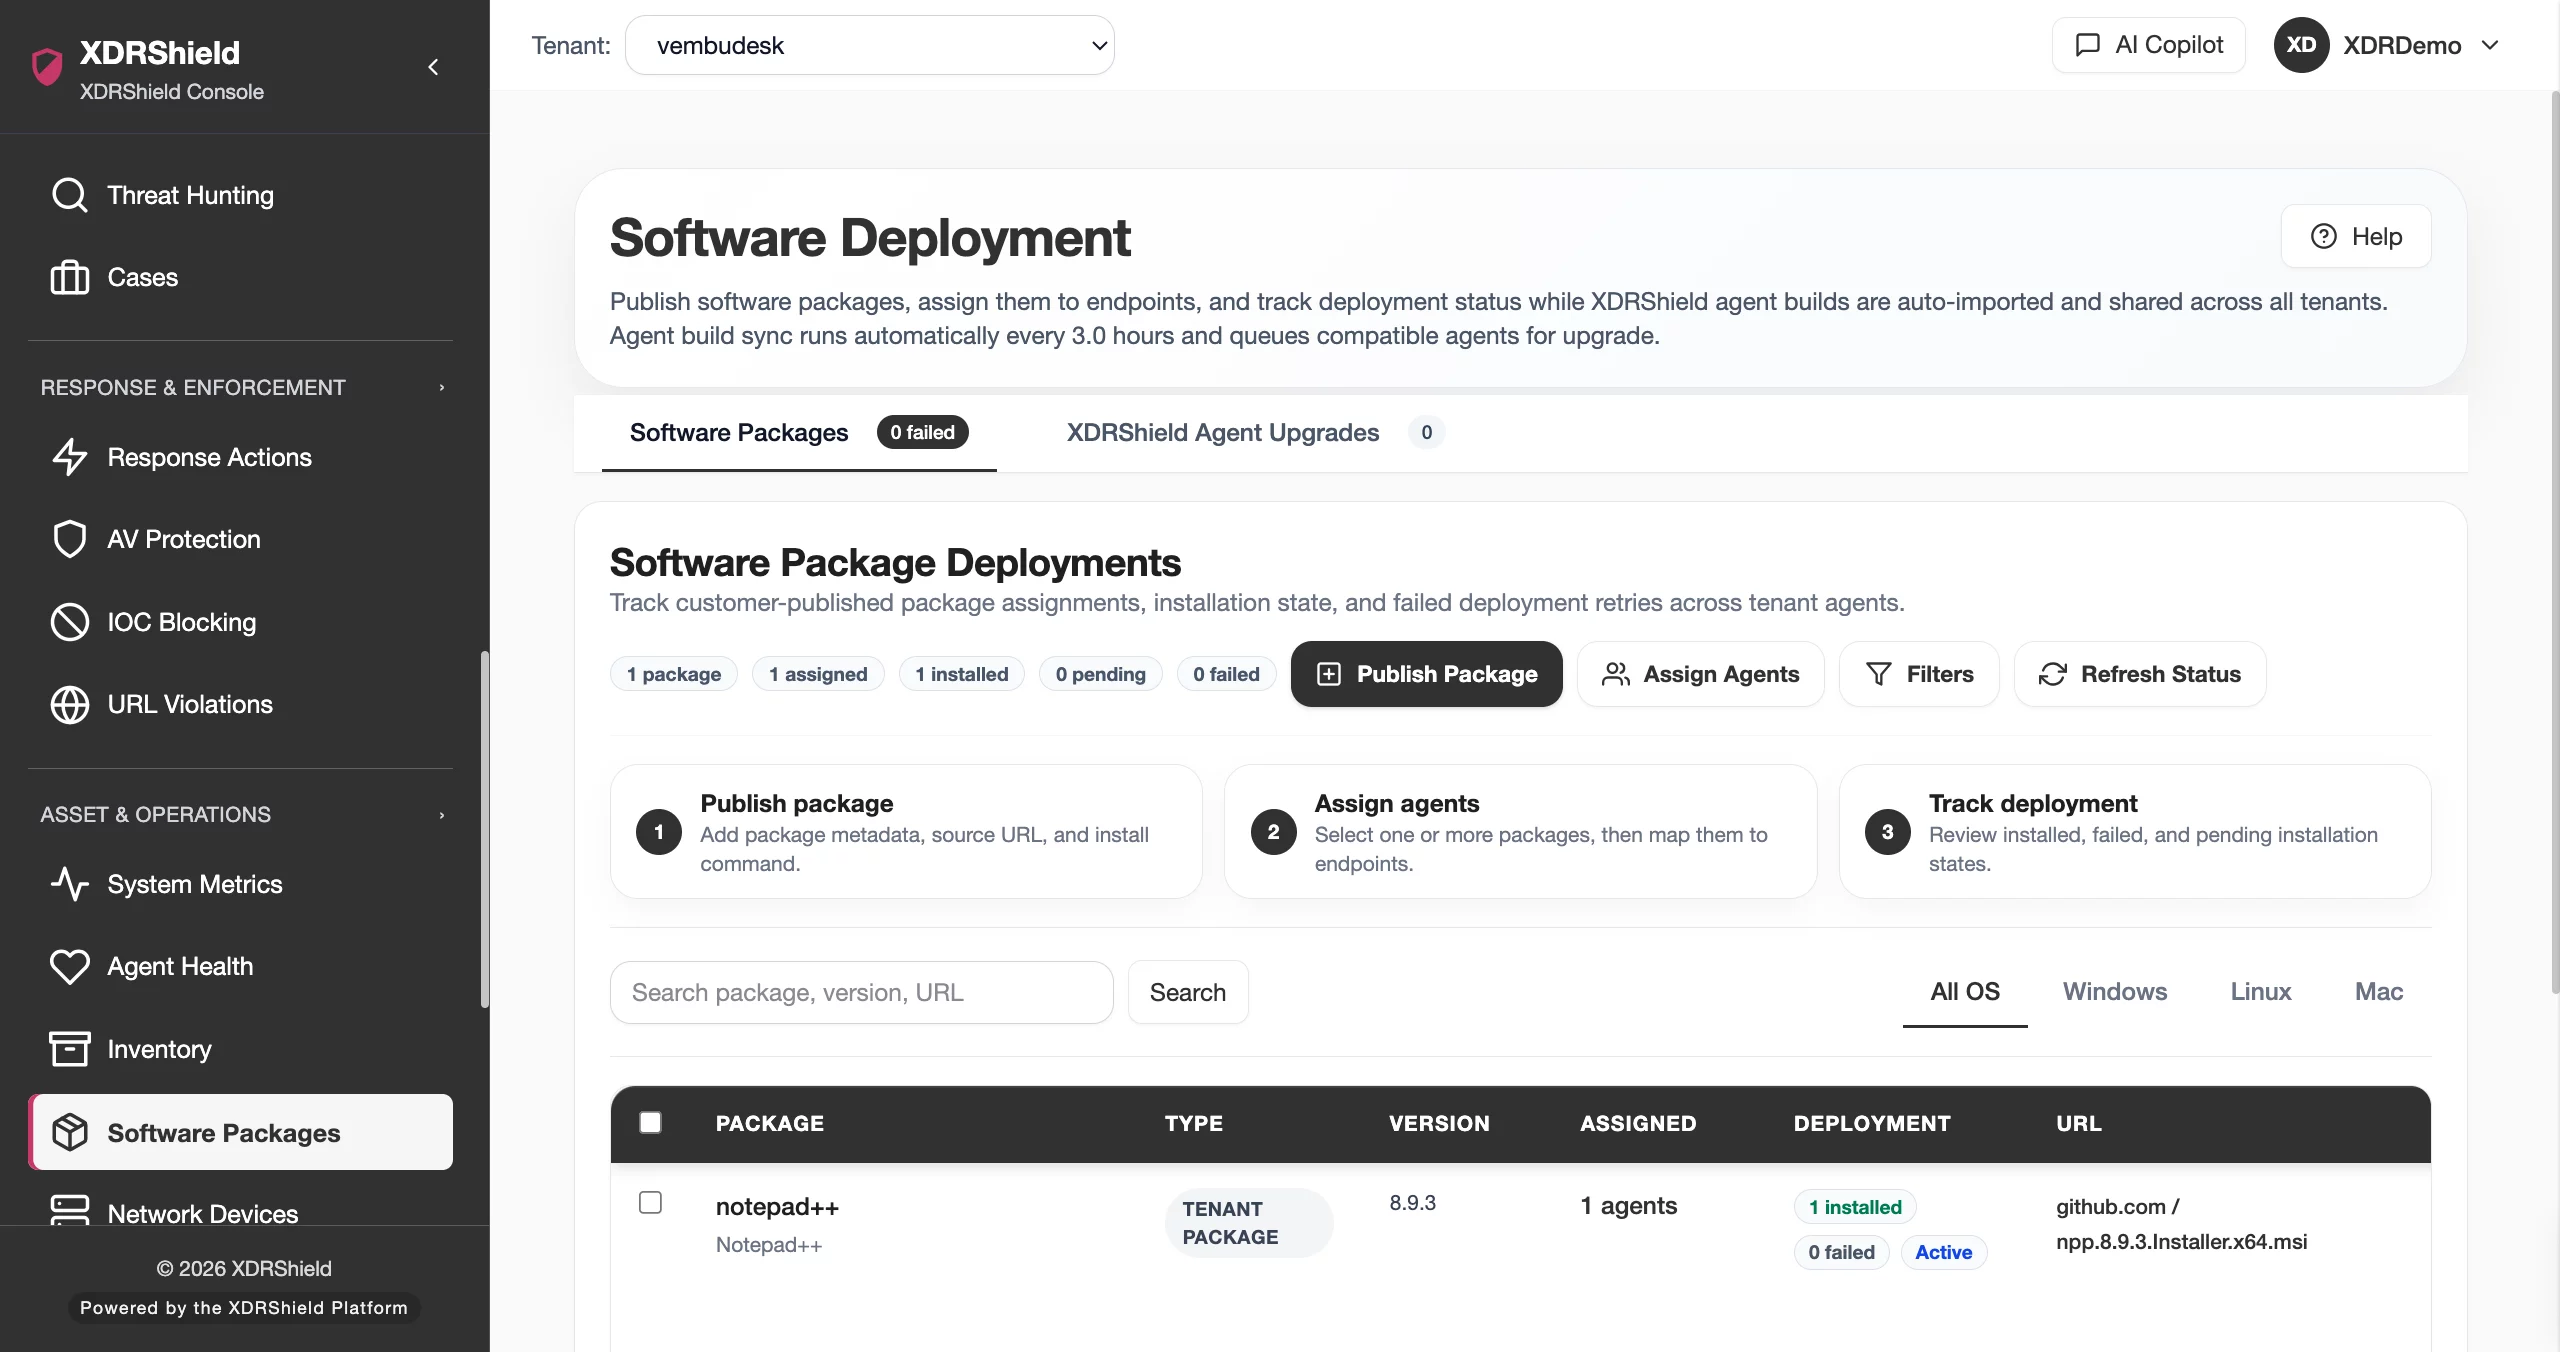
See security, endpoint, and operational posture at a glance before drilling into action.
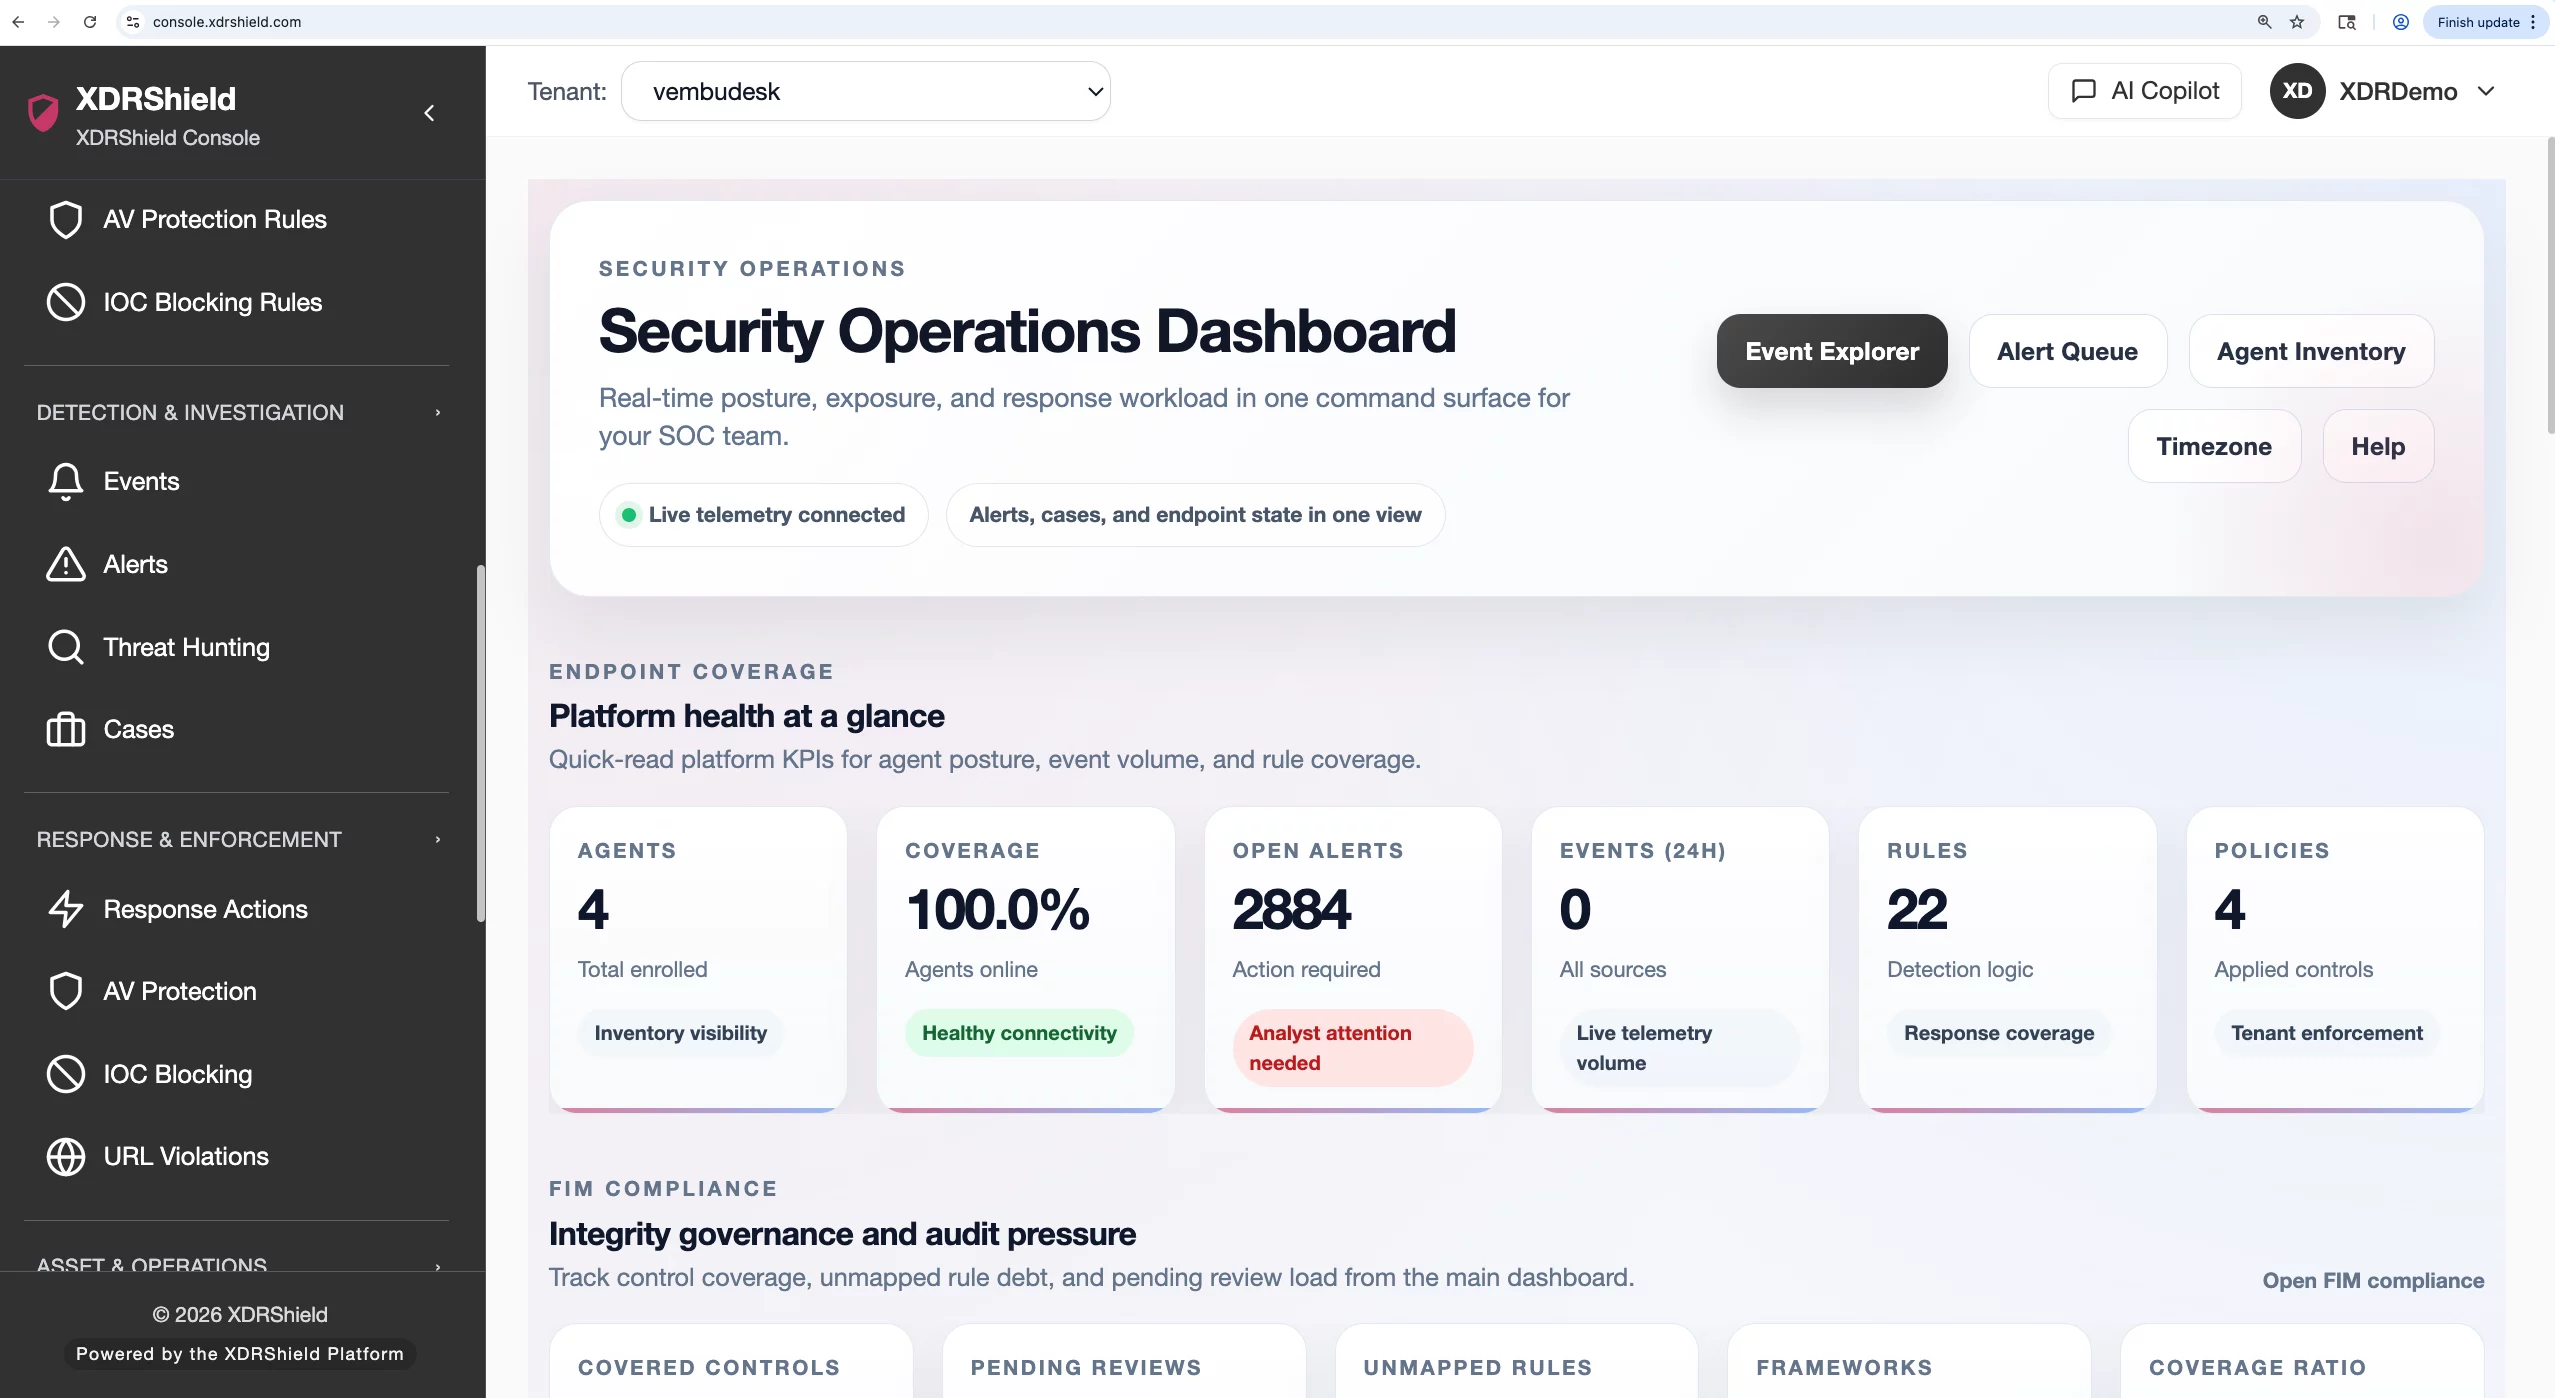
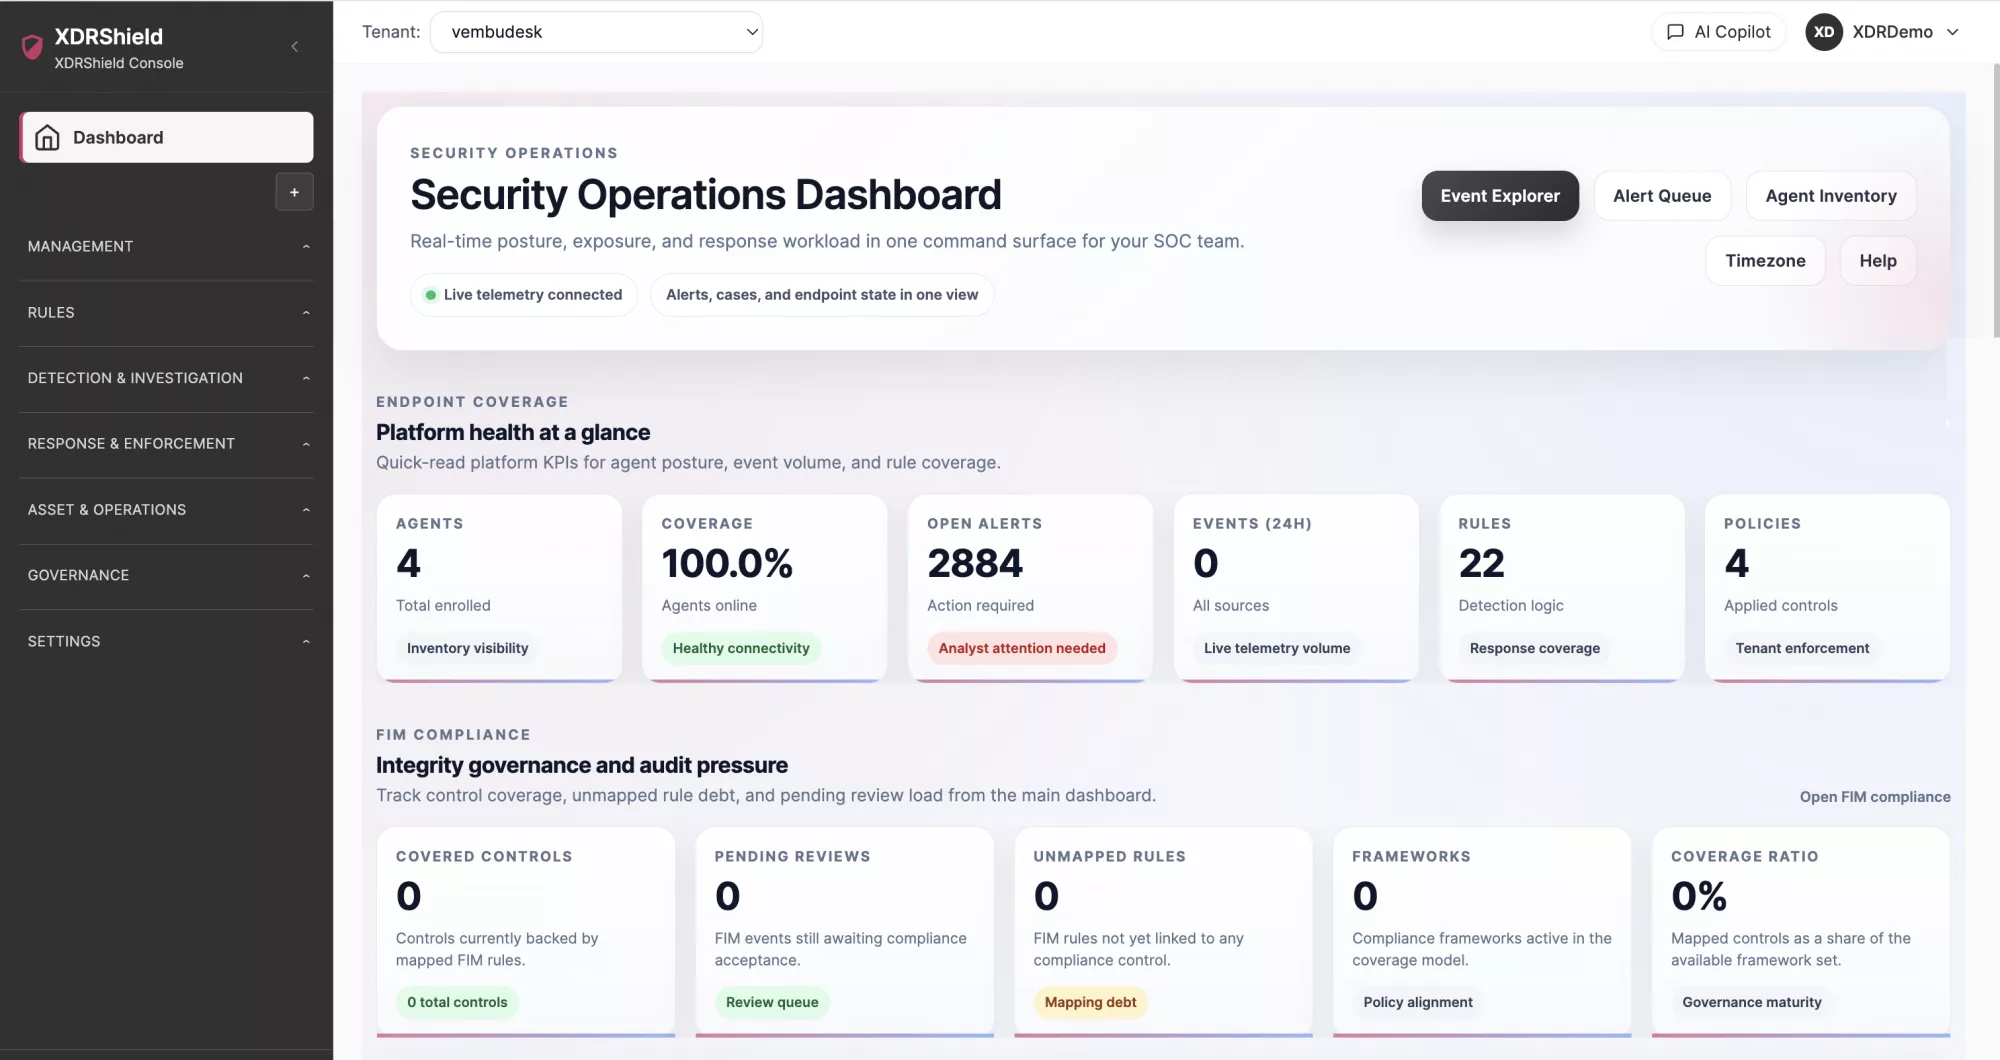
XDRShield Dashboard gives teams a tenant-aware starting point for reviewing alerts, endpoint health, coverage signals, operational trends, and investigation priorities before moving into agents, alerts, events, cases, policies, or response workflows.
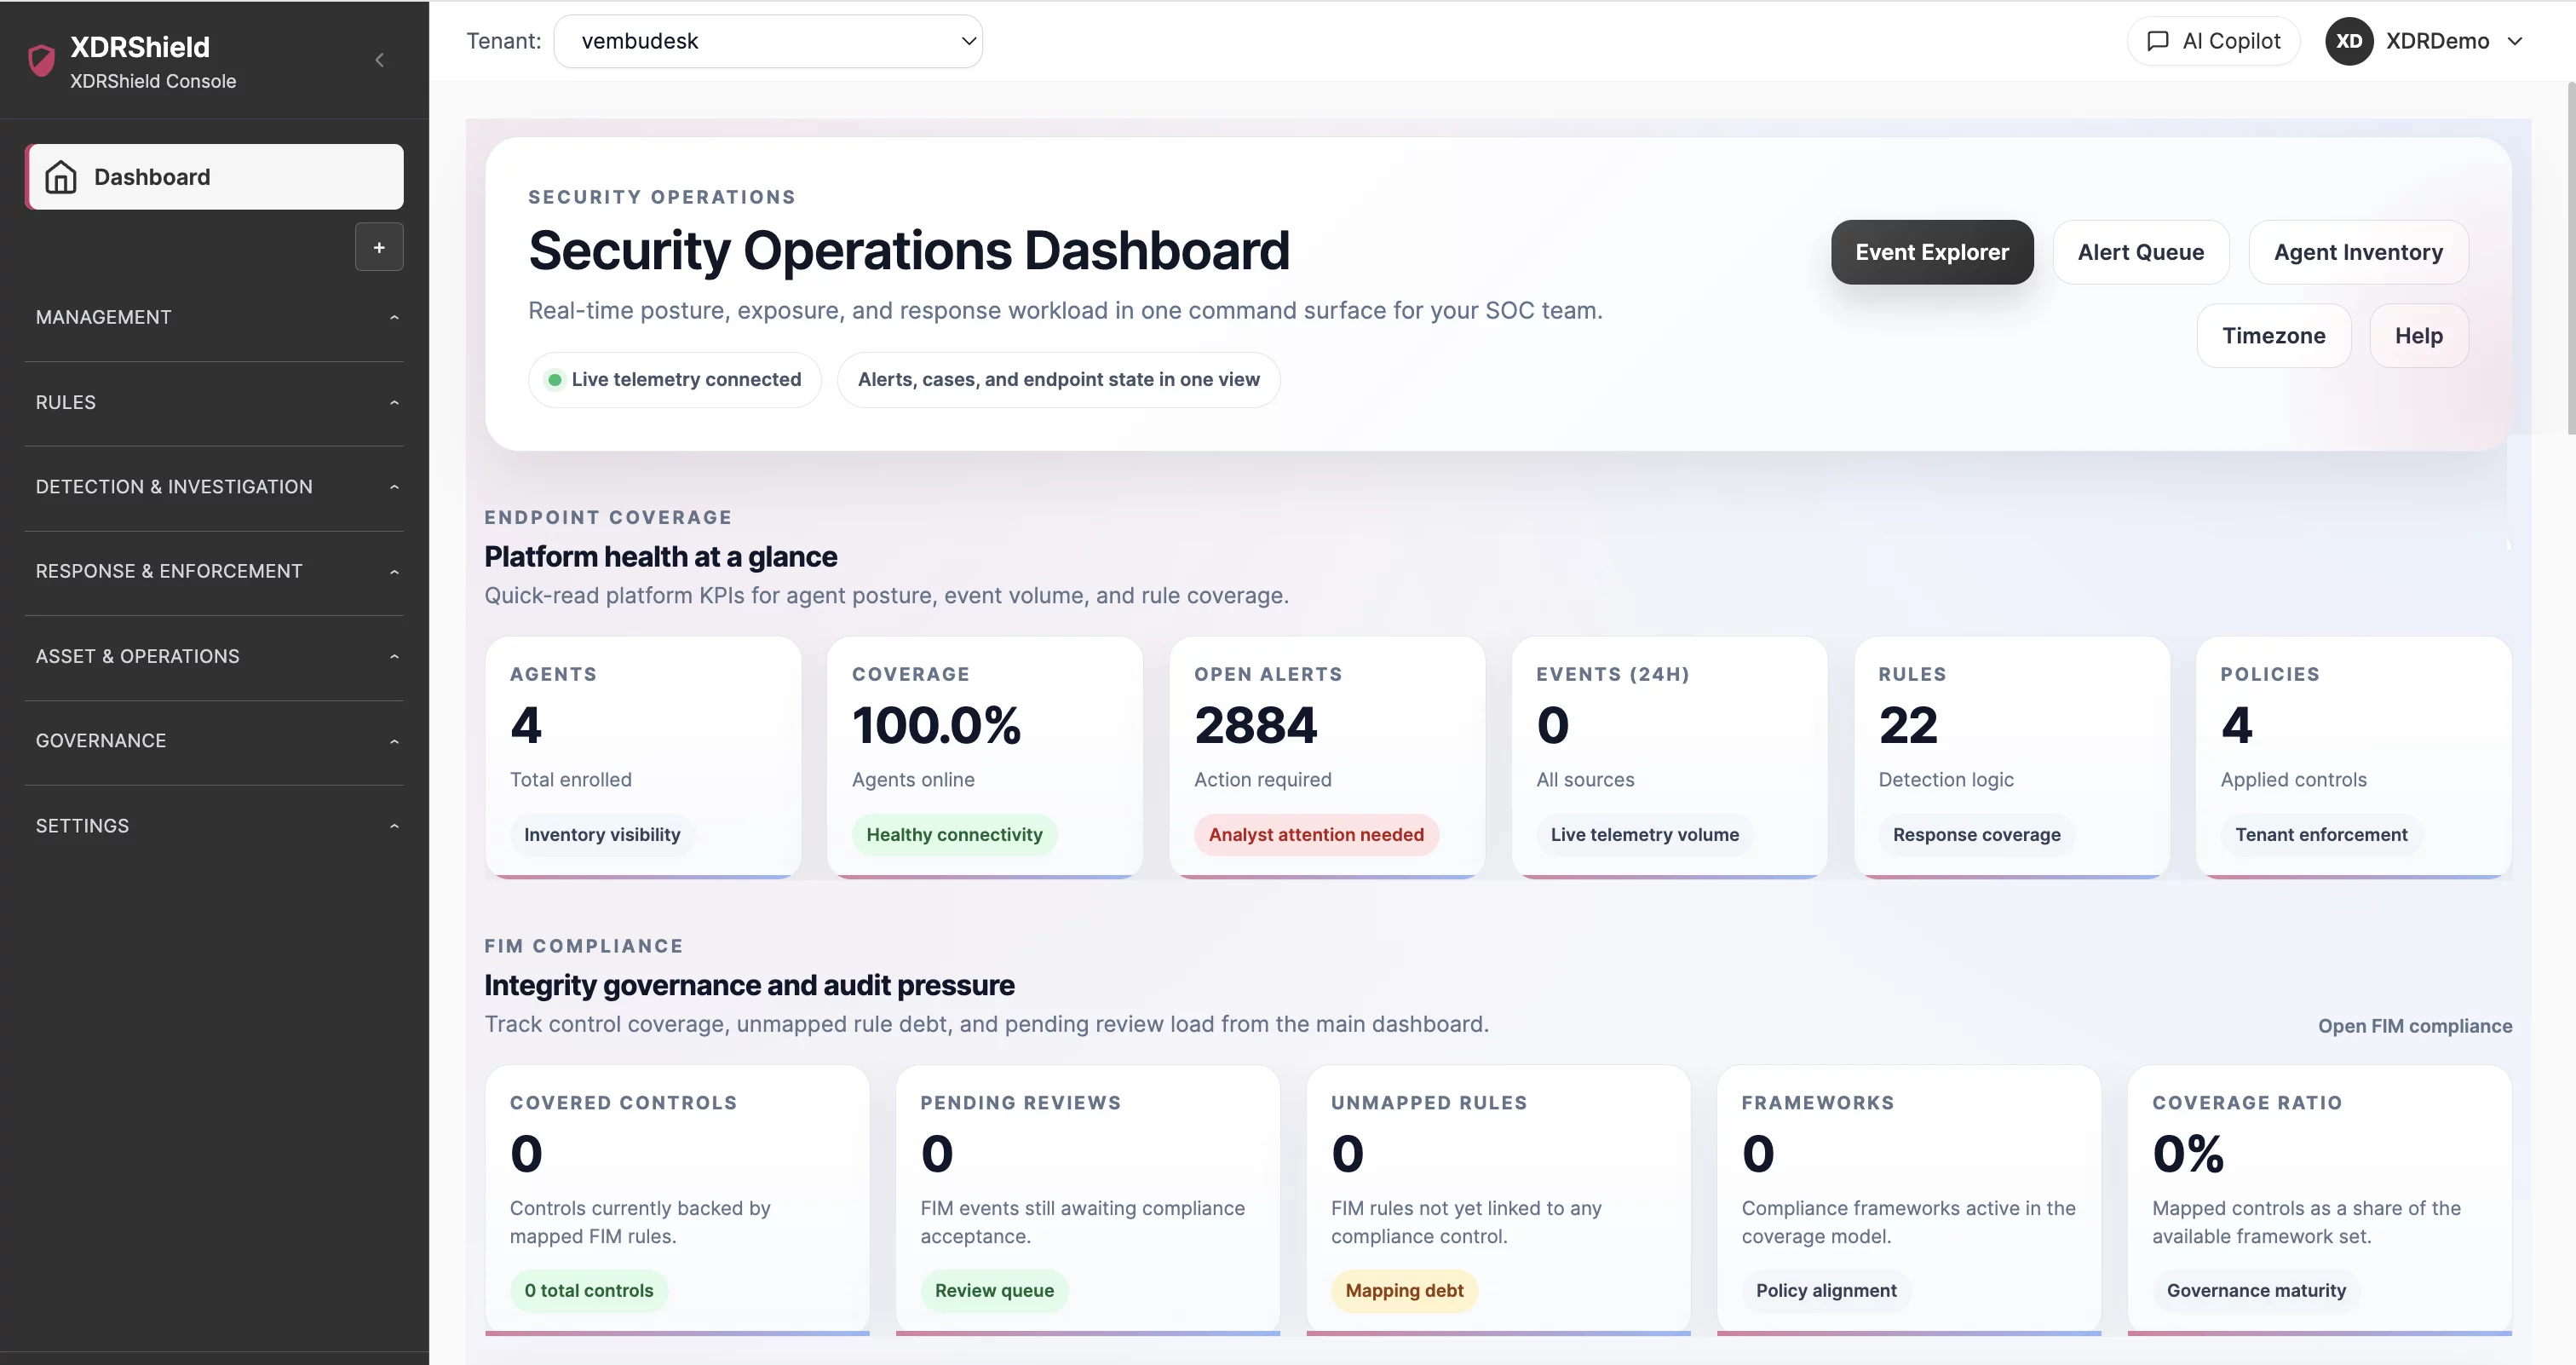
A useful dashboard turns posture signals into the next right action.
Security operations move faster when analysts and operators can see priority alerts, coverage concerns, agent health, and operational trends without opening every feature page first. The dashboard summarizes the environment and points teams toward the workflow that needs attention.
Use dashboard summaries to decide where to investigate next.
The dashboard is the operating front door for XDRShield. It summarizes key security and endpoint posture signals for the selected scope, helping teams identify which queues or workflows need attention, then drill into the detailed page that owns the evidence or action.
- Review alert, endpoint, health, case, and operational signals for the selected tenant or customer scope.
- Use dashboard indicators to decide whether to open Alerts, Events, Agent Health, Cases, Policies, or Response Actions.
- Treat dashboard tiles as summaries; validate important decisions in the detailed workflow pages.
- Use the dashboard during daily review, customer service checks, and incident handoff.
What the XDRShield Dashboard helps teams do.
Each capability supports fast situational awareness and directed follow-up.
Posture overview
Review high-level endpoint, security, health, and operational signals for the selected scope.
Alert priority awareness
Spot security alert pressure and drill into the alert queue for severity and status triage.
Agent health awareness
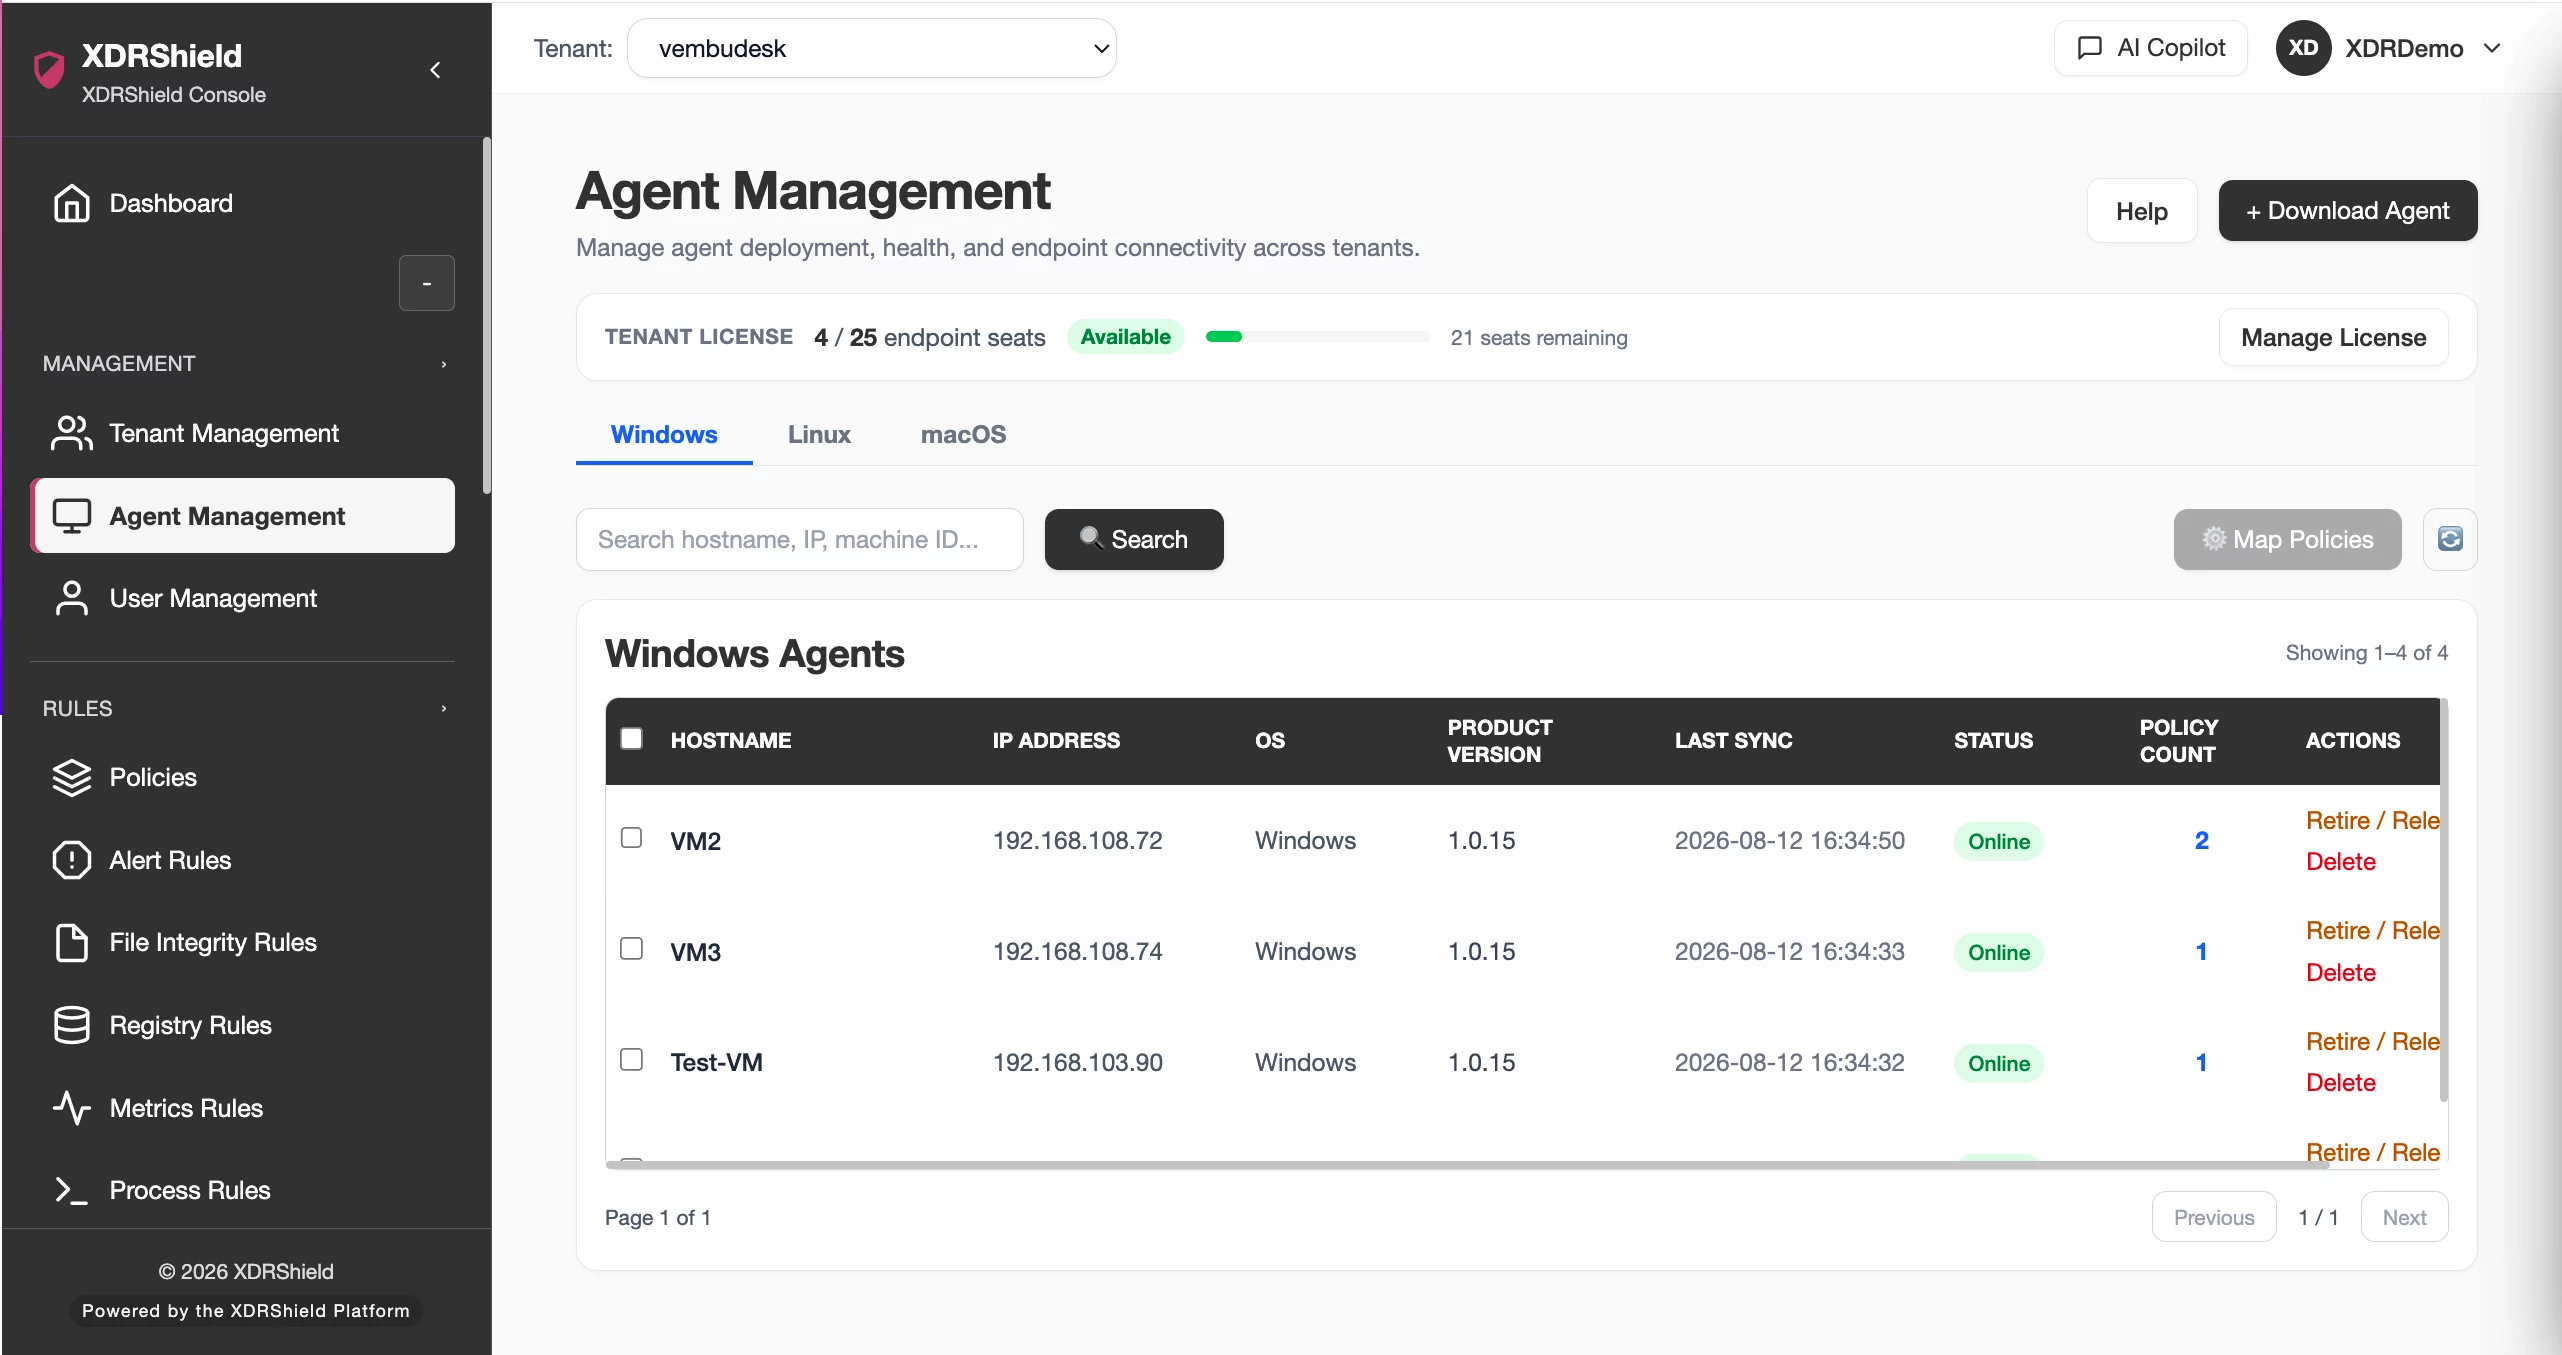
Surface endpoint reporting concerns and move into Agent Health Monitoring for downtime and freshness review.
Case workload visibility
Identify open or aging investigations and drill into Cases for ownership, status, and timeline review.
Evidence drill-down
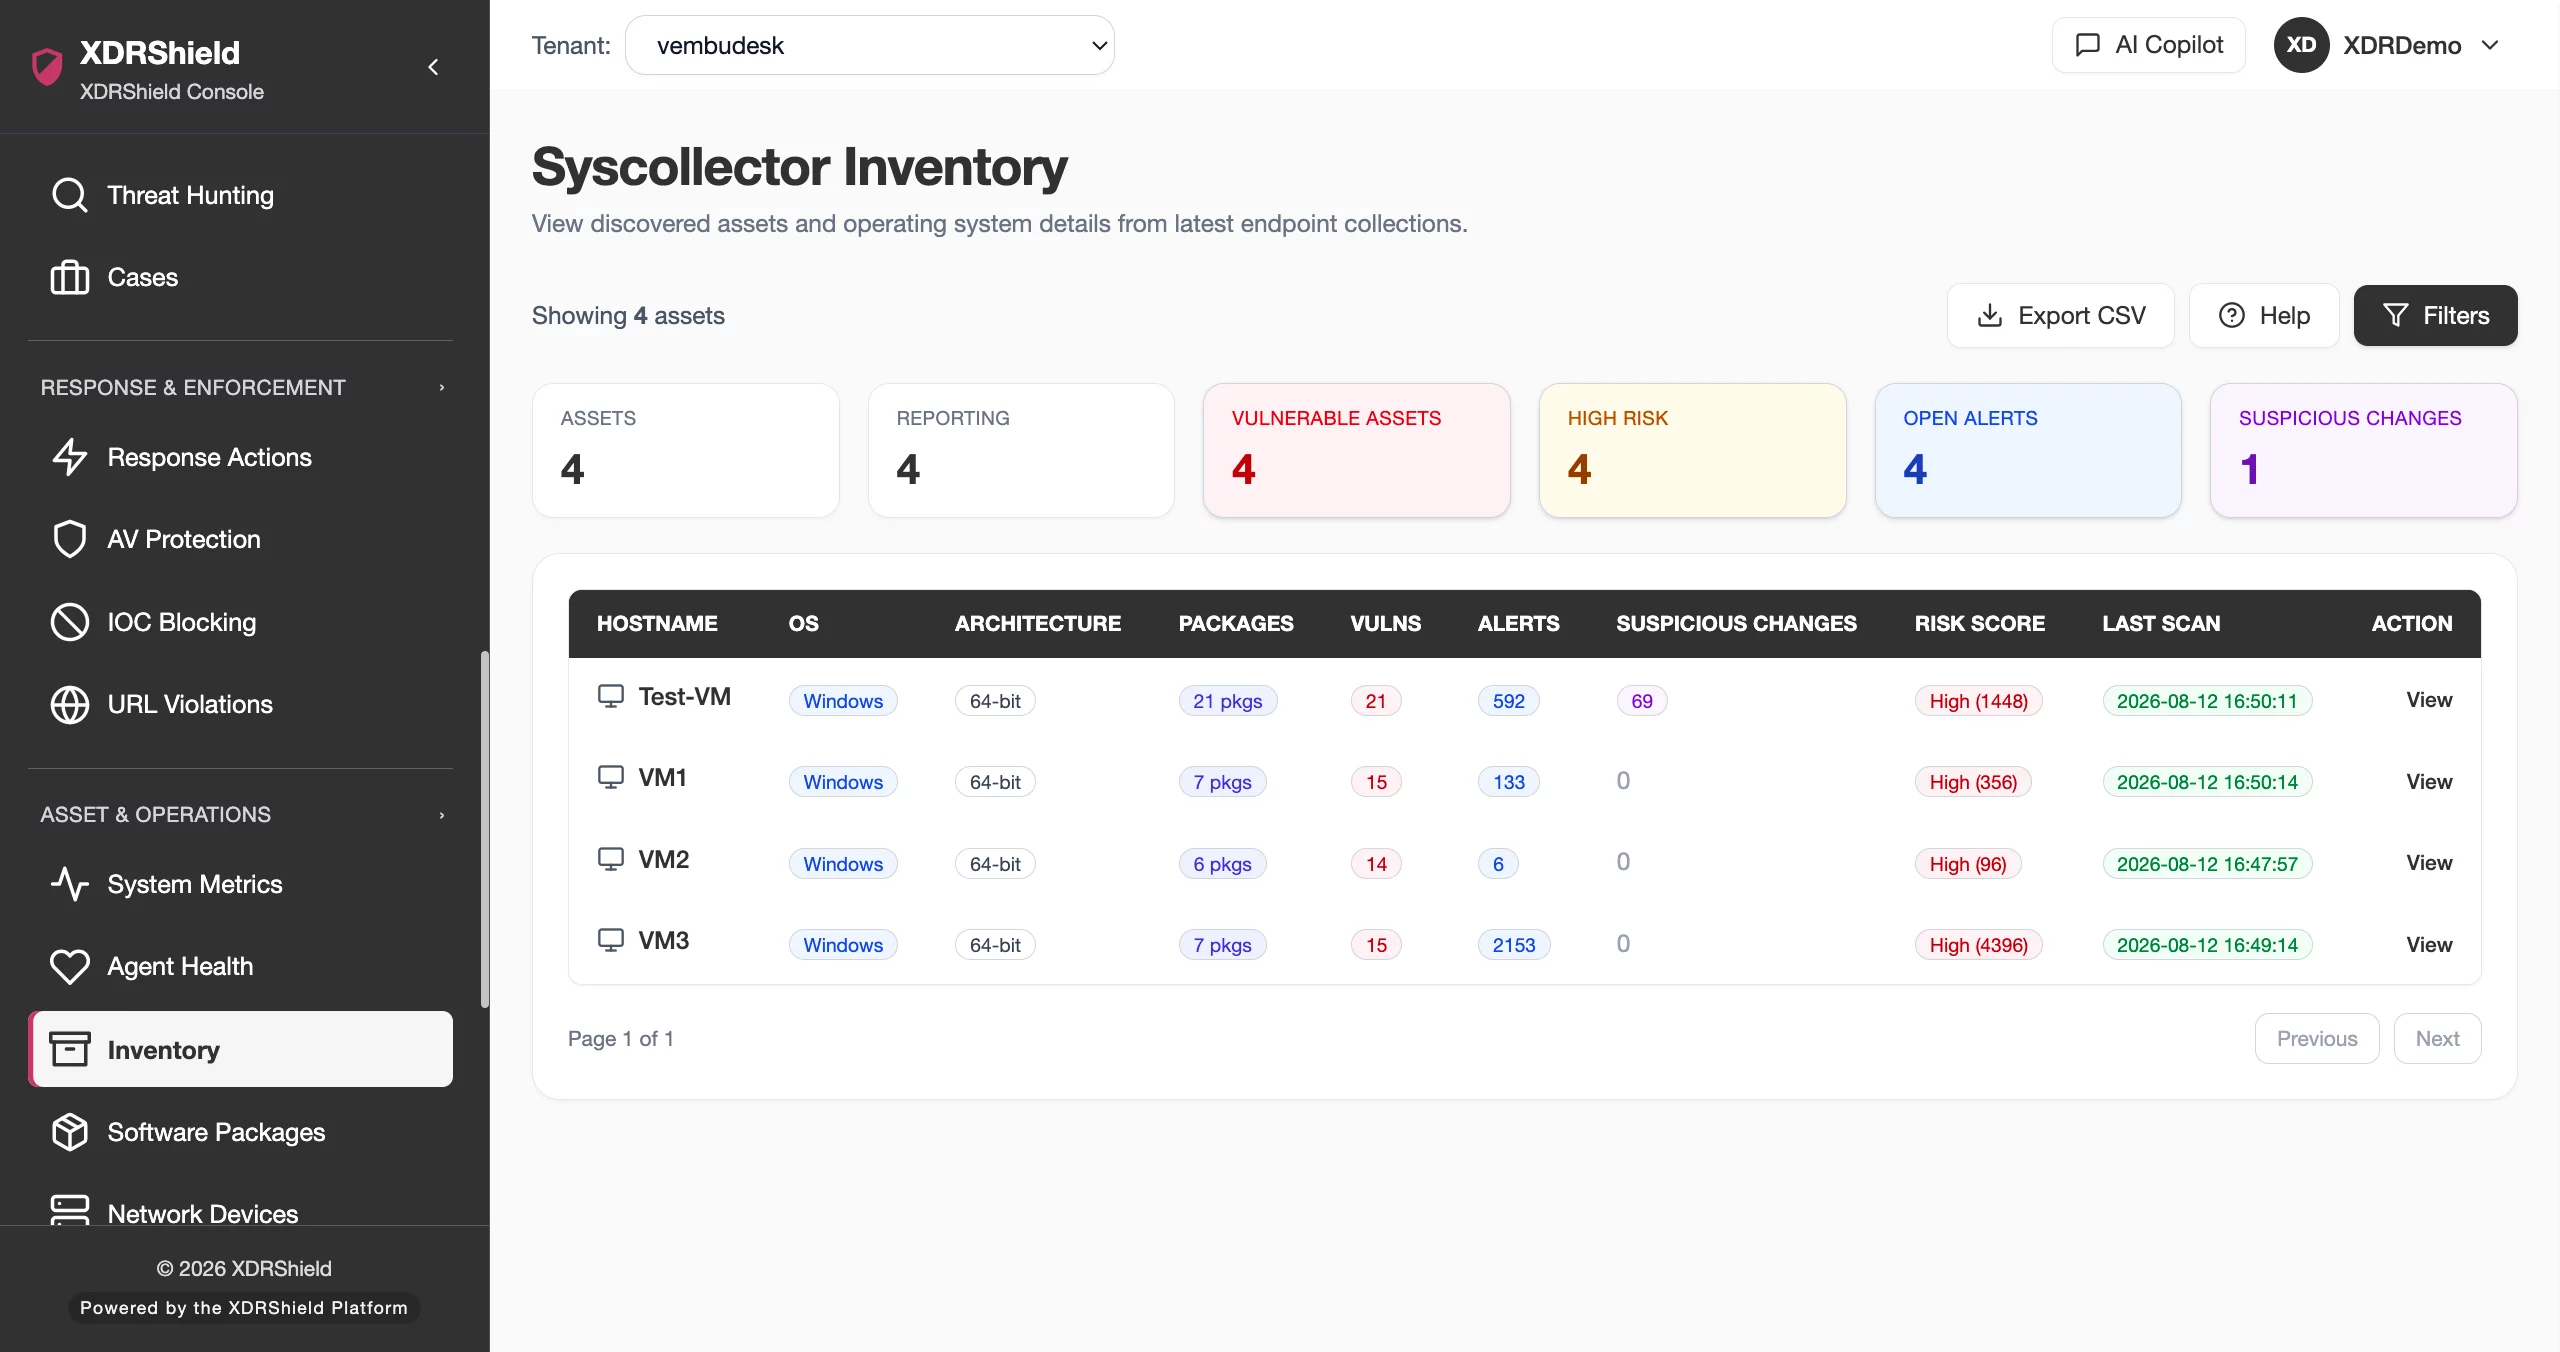
Move from summary signals into Security Events, endpoint context, hunts, and case evidence.
Policy and coverage prompts
Use dashboard coverage concerns as a cue to review policies, sync, and endpoint assignments.
Response readiness context
Use dashboard signals to identify incidents that may require governed response or containment.
Customer or tenant overview
Support MSP review by checking selected-customer posture before drilling into customer-specific workflows.
From dashboard signal to detailed workflow.
A dashboard workflow prevents summary views from becoming a substitute for evidence validation.
Choose the correct scope
Select the customer, tenant, or workspace before interpreting dashboard signals.
Review high-priority signals
Check alert pressure, health concerns, investigation workload, and coverage indicators.
Open the owning workflow
Drill into Alerts, Events, Agent Health, Cases, Policies, or Response Actions based on the signal.
Validate evidence
Use detailed pages to confirm affected endpoint, time range, status, owner, and supporting evidence.
Assign or act
Create cases, assign owners, tune policy, fix agent health, or request governed response as needed.
Return for review
Use the dashboard again after action to confirm the operational view reflects progress.
Where Dashboard helps most.
Use the dashboard when teams need fast posture orientation before choosing the detailed workflow.
Daily operations review
Start the day with a tenant-aware view of alert, endpoint, health, and investigation pressure.
MSP customer check-ins
Review customer posture quickly before opening customer-specific alert, case, or agent queues.
Incident handoff
Orient the next analyst to current alert pressure, open work, and follow-up areas.
Coverage and health follow-up
Spot endpoints or health signals that require Agent Health or Agent Management review.
Management reporting preparation
Use dashboard summaries to decide which detailed evidence exports or pages need review.
Policy rollout monitoring
Watch for coverage or alert changes after policy updates, then validate in detailed policy and event pages.
Use summaries as a starting point, not the final evidence.
This table clarifies how to move from dashboard signals into the detailed XDRShield workflow.
| Area | What it means | How teams use it |
|---|---|---|
| Alert signal | A summary of detection pressure or alert queue state for the selected scope. | Open Security Alerts to filter by severity, status, host, title, and evidence. |
| Agent health signal | A summary of reporting or endpoint health concerns. | Open Agent Health Monitoring or Agent Management to review last sync, availability, and version context. |
| Case signal | A summary of investigation workload or aging work. | Open Cases to review owner, severity, status, SLA, evidence, and timeline. |
| Coverage or policy signal | A cue that endpoint assignment, policy sync, or monitoring coverage needs review. | Open Security Policy Management, Agent Management, or Events to validate details. |
Dashboard for SOC, IT, and MSP teams.
The dashboard provides shared orientation while detailed workflows provide evidence and action.
For SOC and IT teams
Use the dashboard to identify the next queue or workflow that needs attention.
- Start with the selected tenant or workspace.
- Drill into detailed pages for evidence validation.
- Use summaries to guide prioritization, not final decisions.
For MSP and customer operations
Use dashboard scope to review customer posture, then open customer-specific agents, alerts, cases, policies, or activity evidence.
- Validate customer scope before interpreting metrics.
- Use dashboard signals for service review preparation.
- Drill into detailed evidence before customer-facing conclusions.
Dashboard FAQs.
What is the XDRShield Dashboard?
The XDRShield Dashboard is a tenant-aware starting view that summarizes security, endpoint, health, case, and operational signals so teams can decide which workflow needs attention next.
Should dashboard summaries be used as final evidence?
No. Dashboard signals are summaries. Important operational, security, or customer-facing decisions should be validated in detailed pages such as Alerts, Events, Agent Health, Cases, Policies, or Response Actions.
How does the dashboard support MSP operations?
MSP teams can review customer or tenant posture in the selected scope, then drill into customer-specific workflows for alerts, agents, cases, policies, activity logs, and response actions.
What should teams check first on the dashboard?
Teams should confirm the selected scope, then review priority alerts, agent health or coverage concerns, case workload, and any operational signals requiring follow-up.
How does the dashboard connect to investigations?
Dashboard signals can guide analysts into Security Alerts, Security Events, Threat Hunting, Cases, and Response Actions where detailed evidence and accountable action are managed.
Start with the dashboard, then validate in the owning workflow.
Use XDRShield Dashboard to orient daily operations, identify priority queues, and drill into the detailed evidence needed for confident security action.