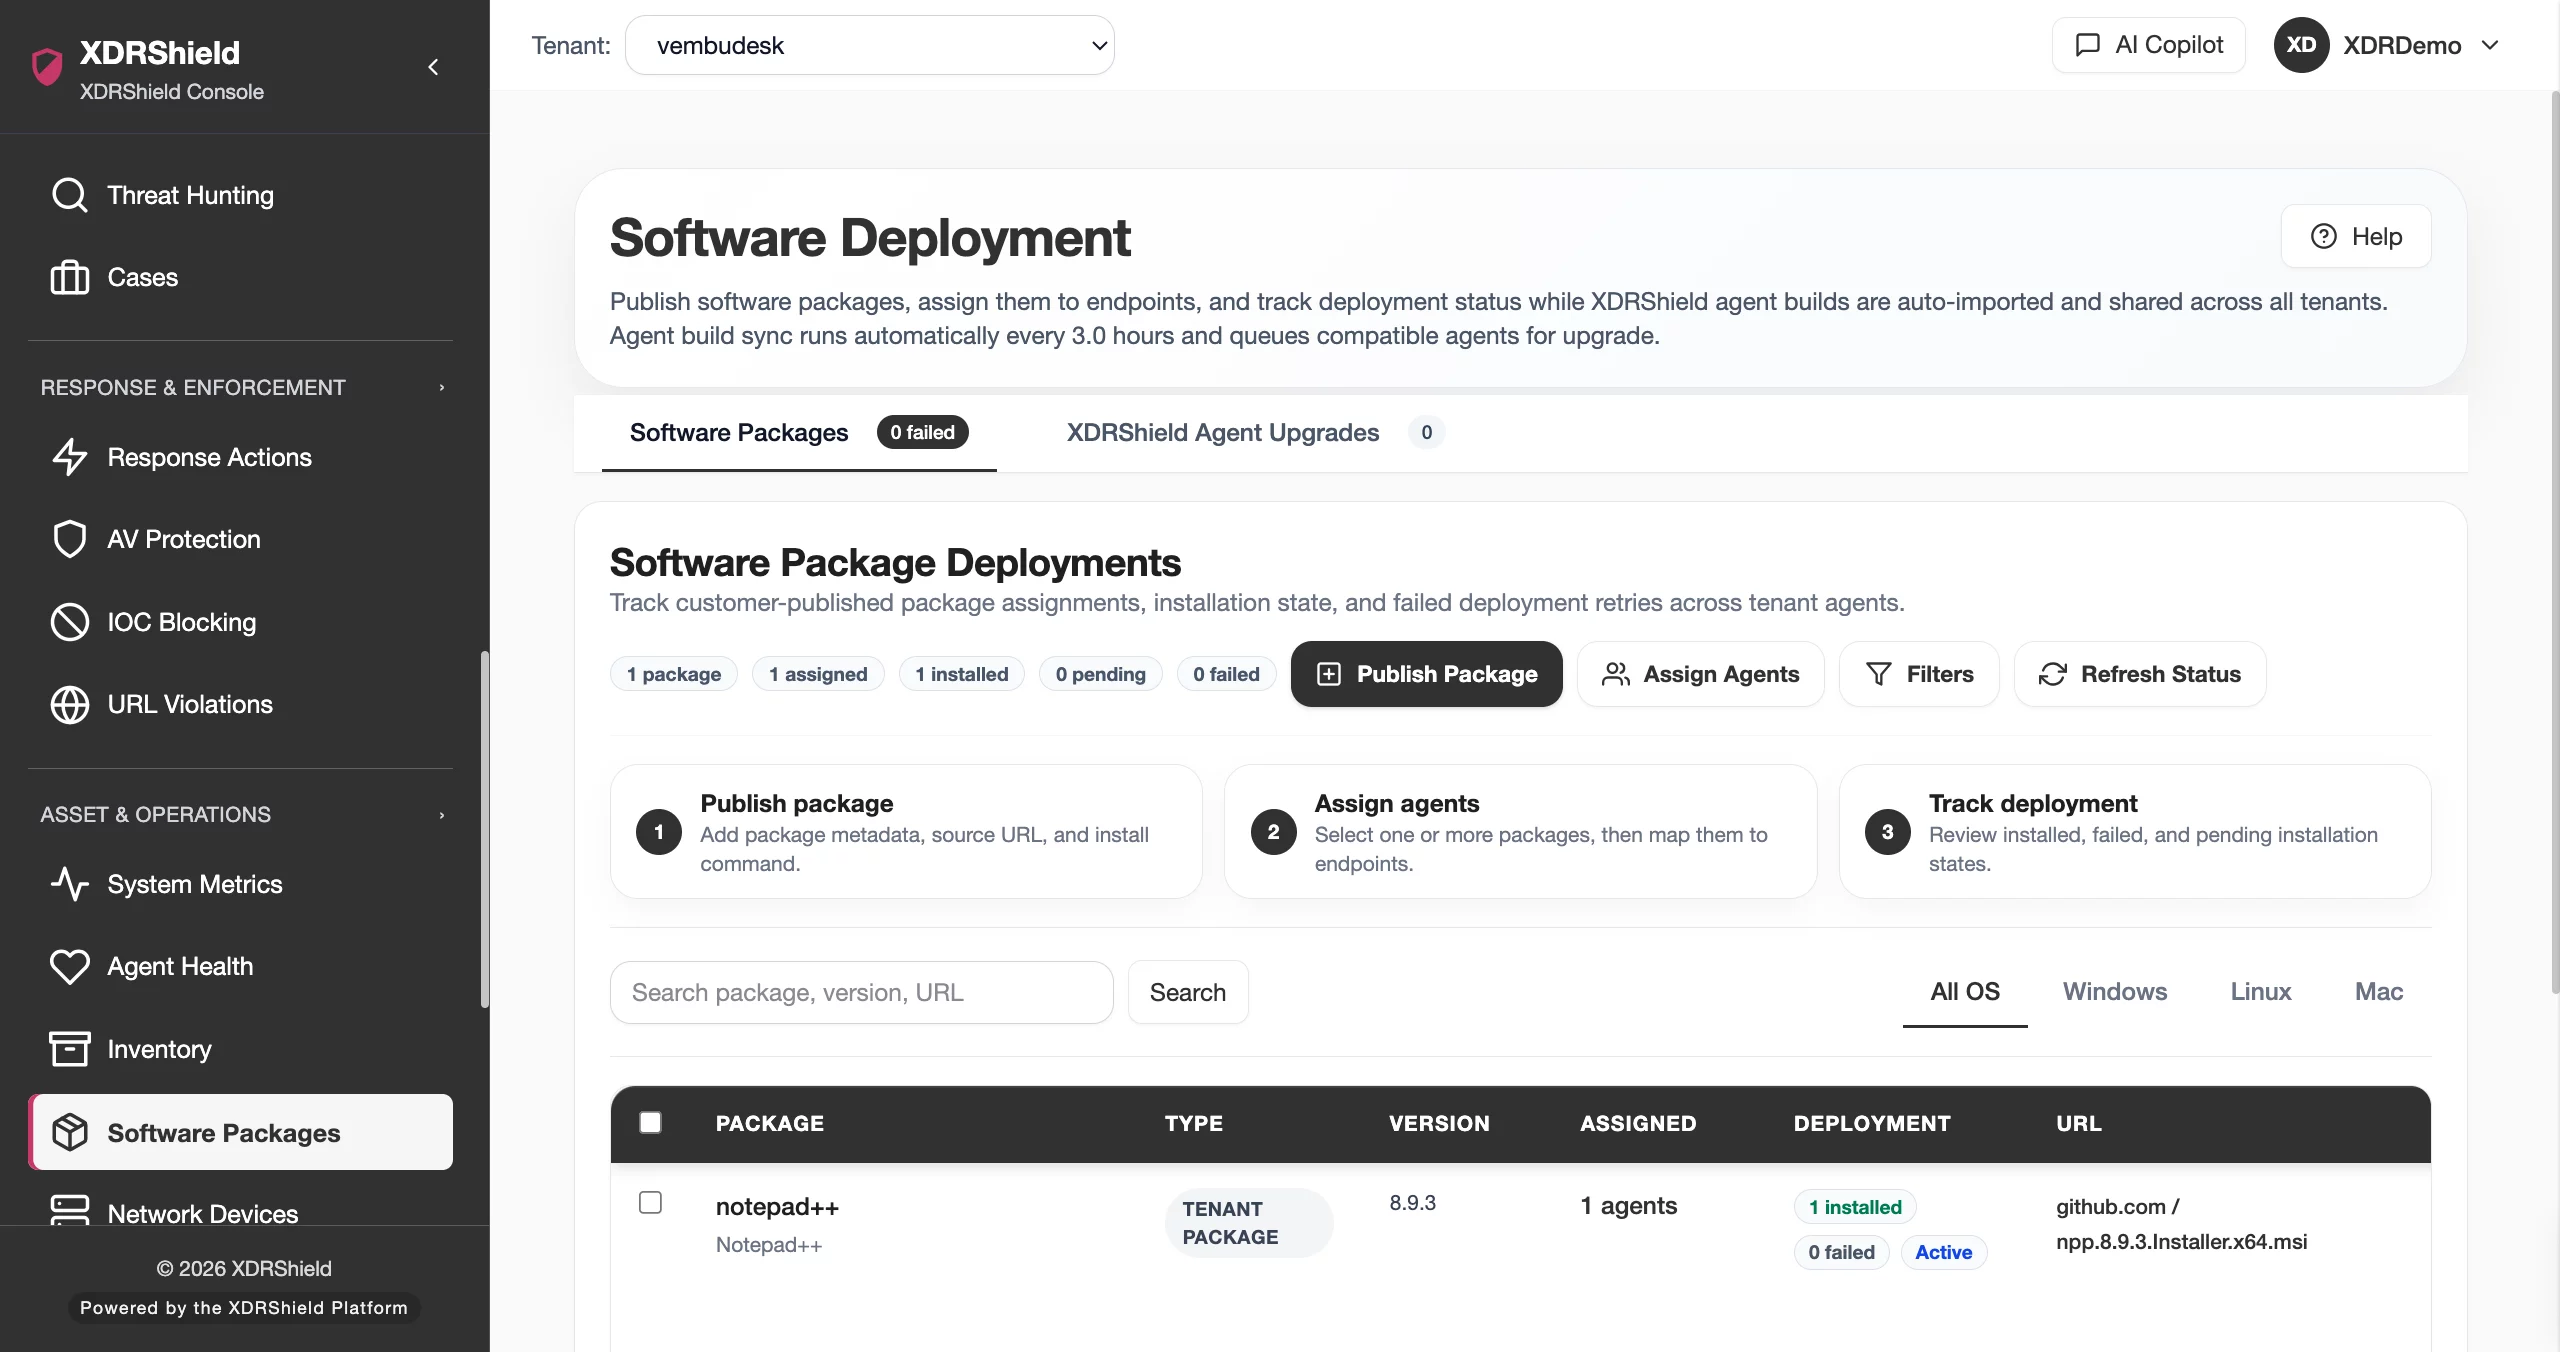
Search endpoint telemetry, review event trends, and correlate raw events with alerts.
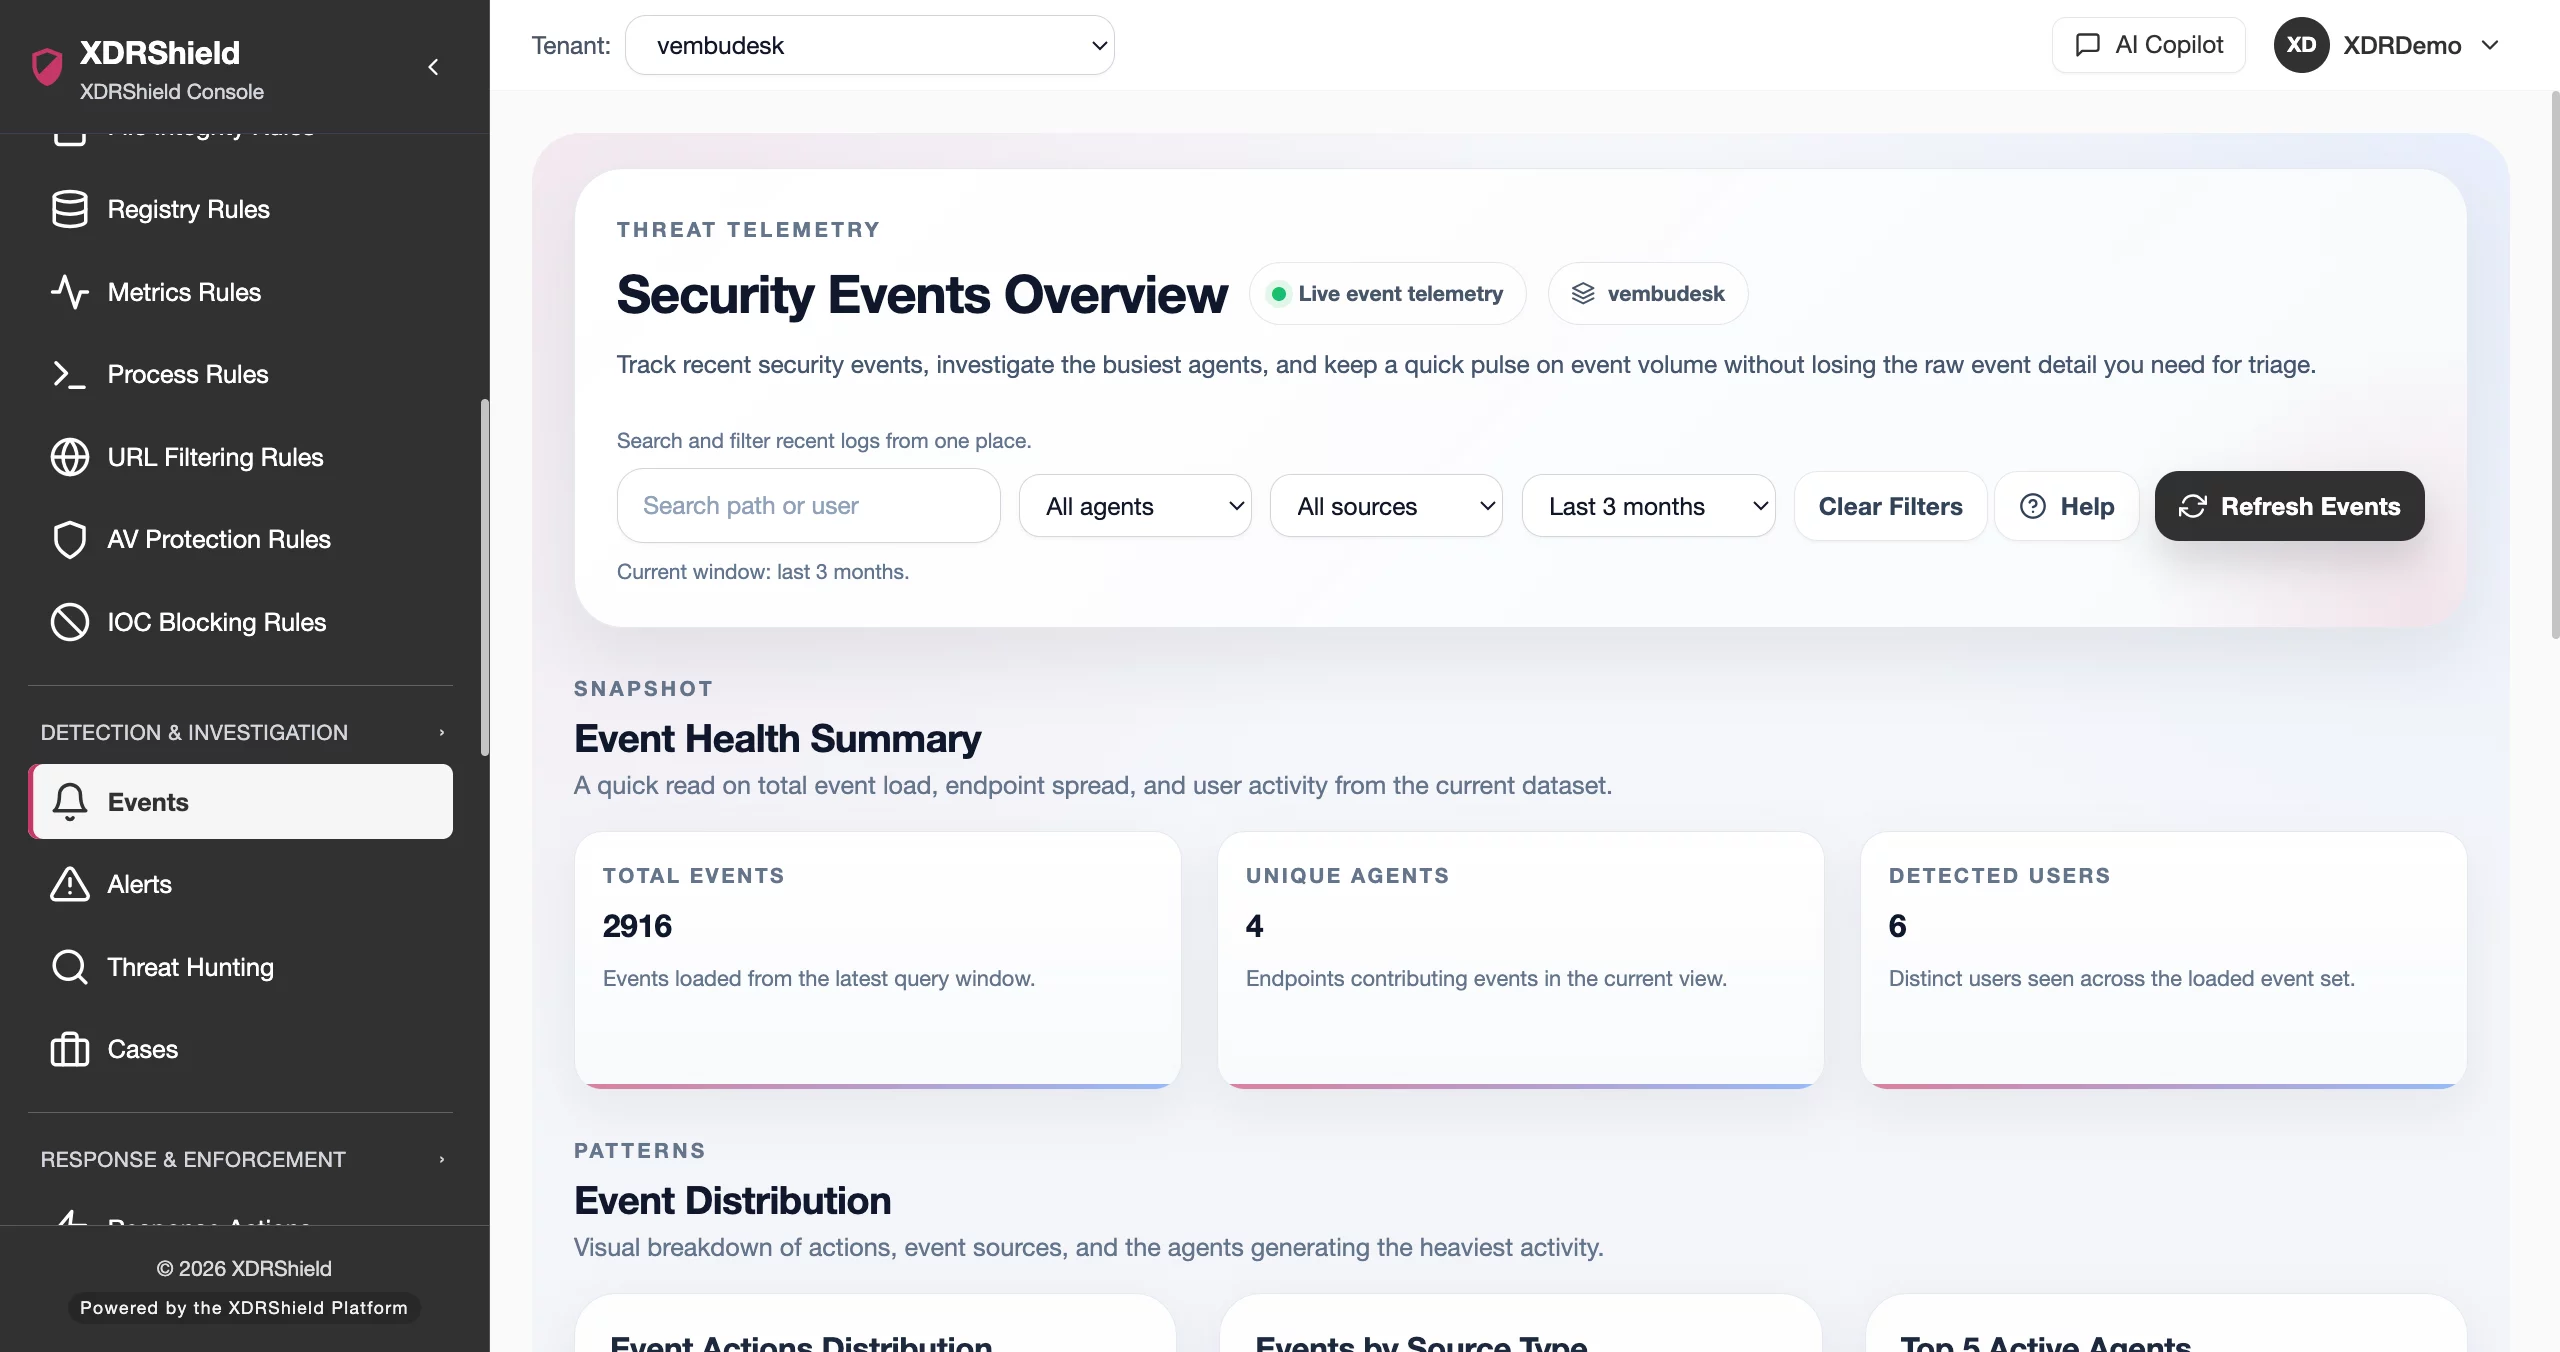
XDRShield Security Events gives security teams recent endpoint telemetry, trending patterns, and a searchable raw event stream for investigation, triage, and evidence collection. Summary cards, distribution charts, and top-agent breakdowns help analysts find what changed, understand why, and correlate events with alerts.
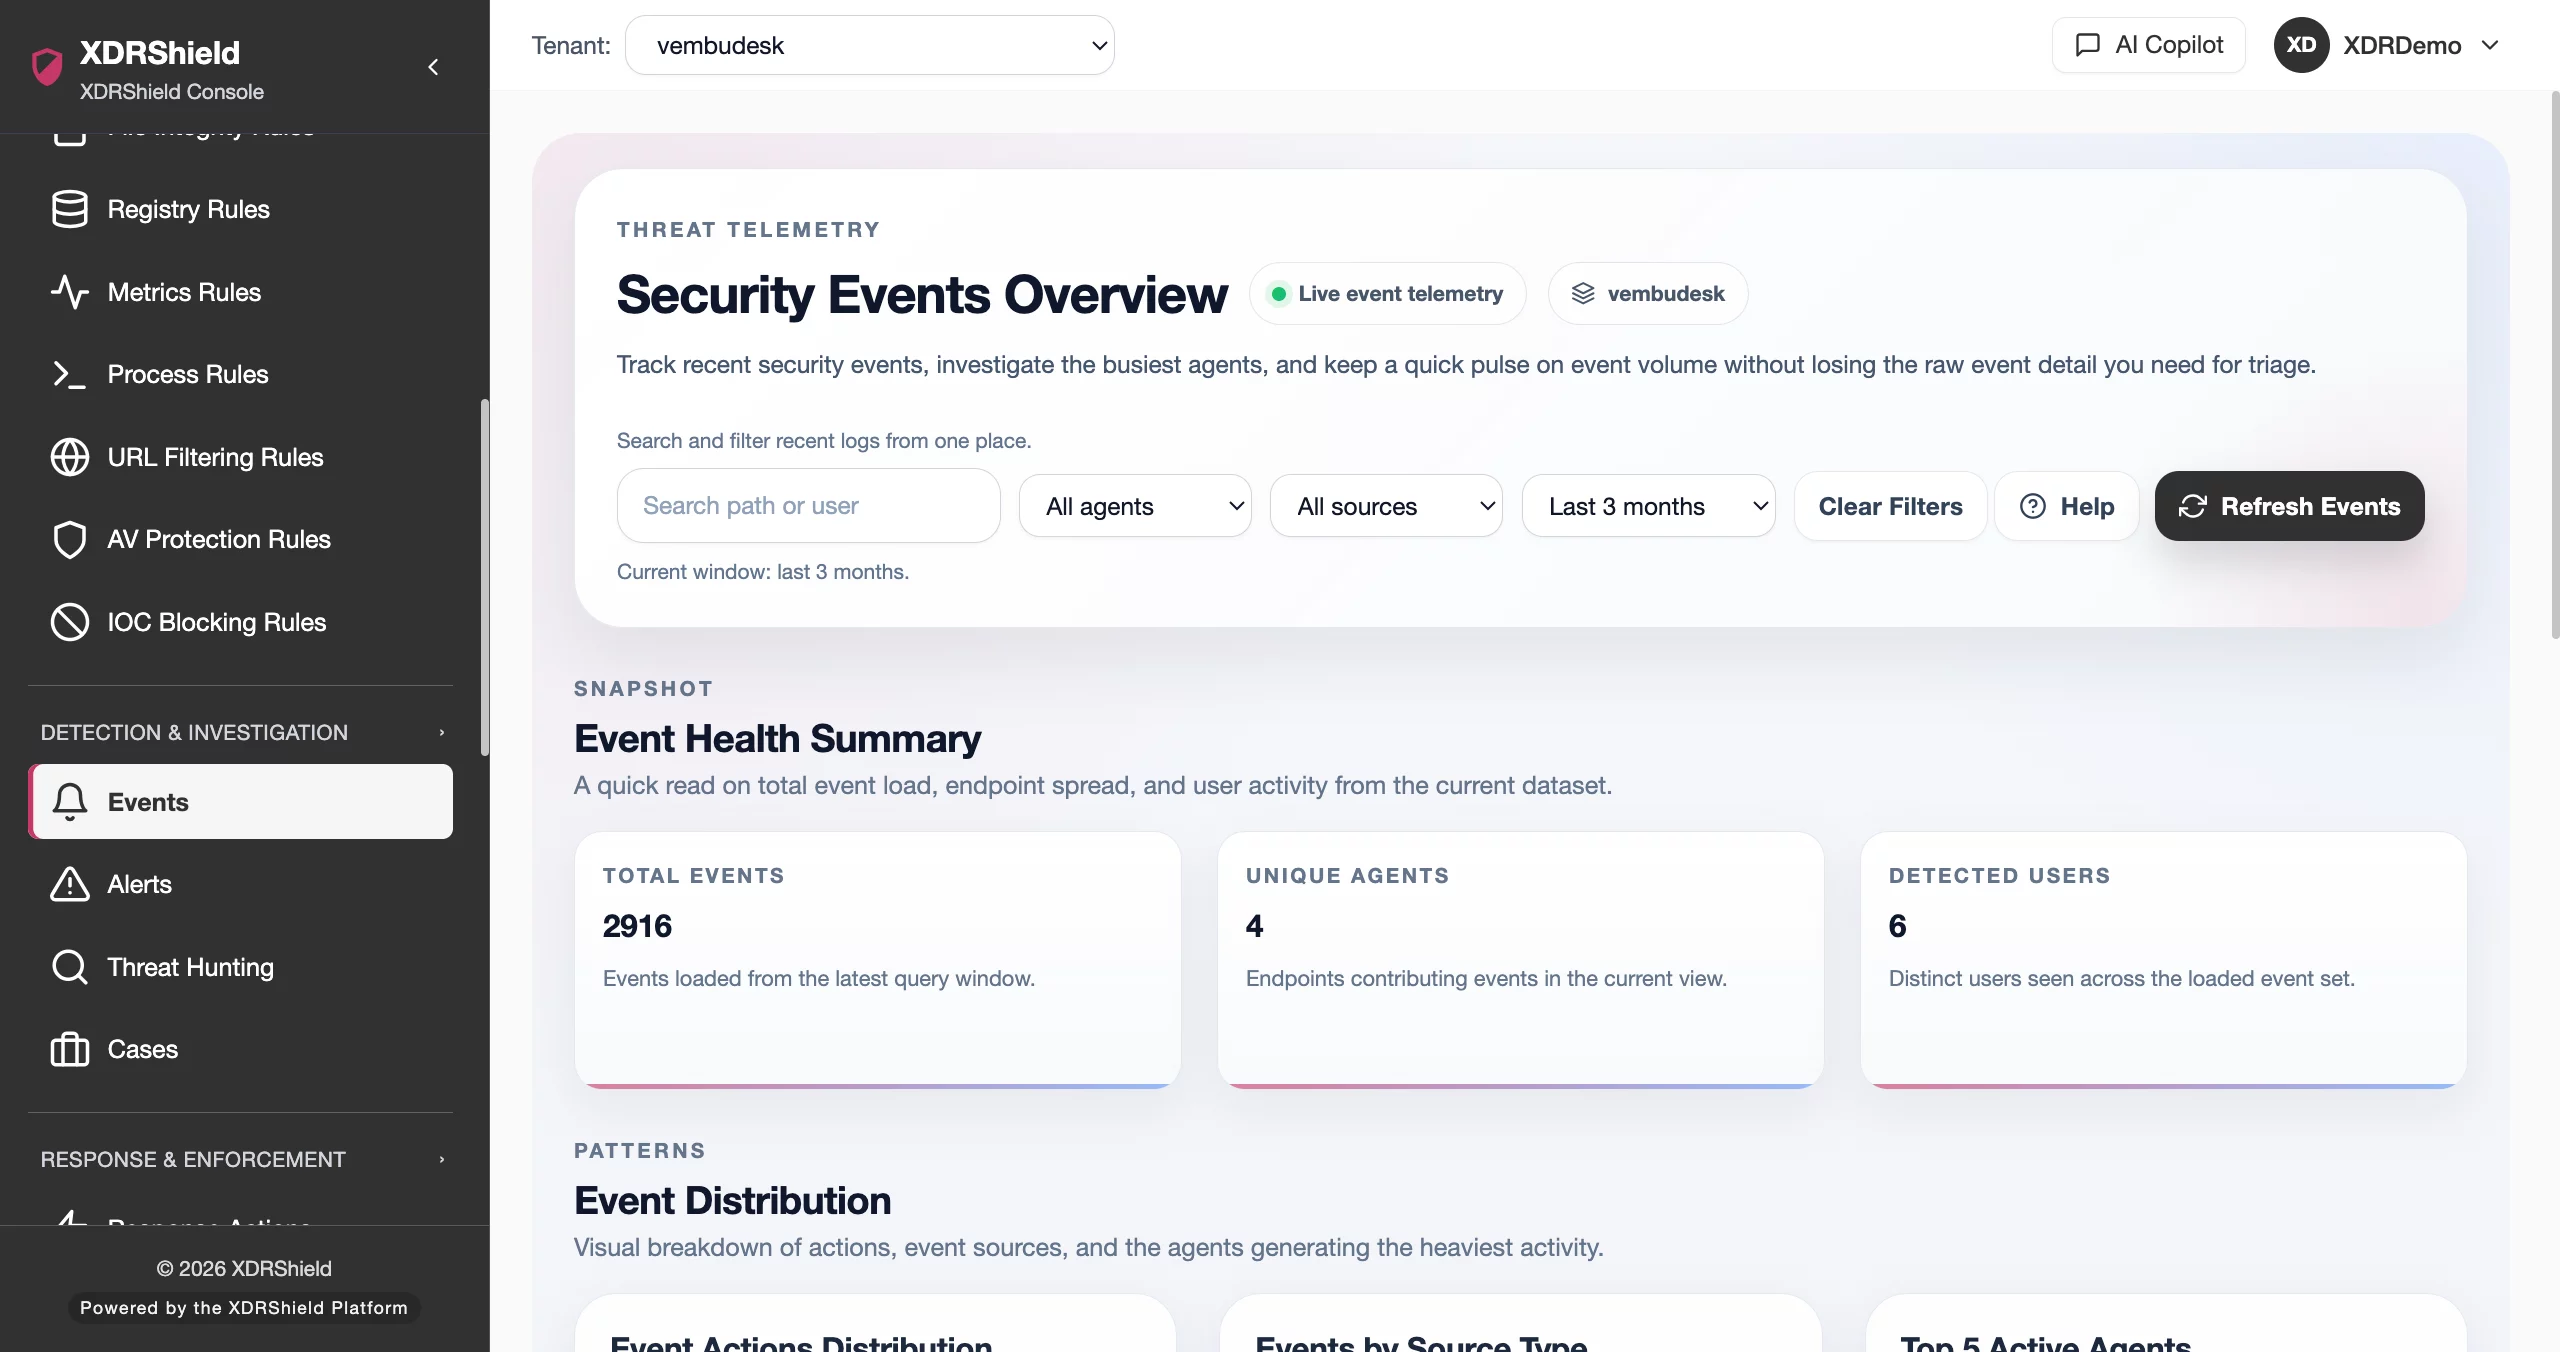
Endpoint events are the evidence layer behind every alert, investigation, and compliance review.
Security events provide the raw telemetry that teams need to understand endpoint activity, validate alerts, investigate incidents, and prove compliance. Without searchable event data, teams rely on alerts alone and lose the context needed for thorough investigation.
Endpoint telemetry flows from agents into searchable events, summaries, and alert correlation.
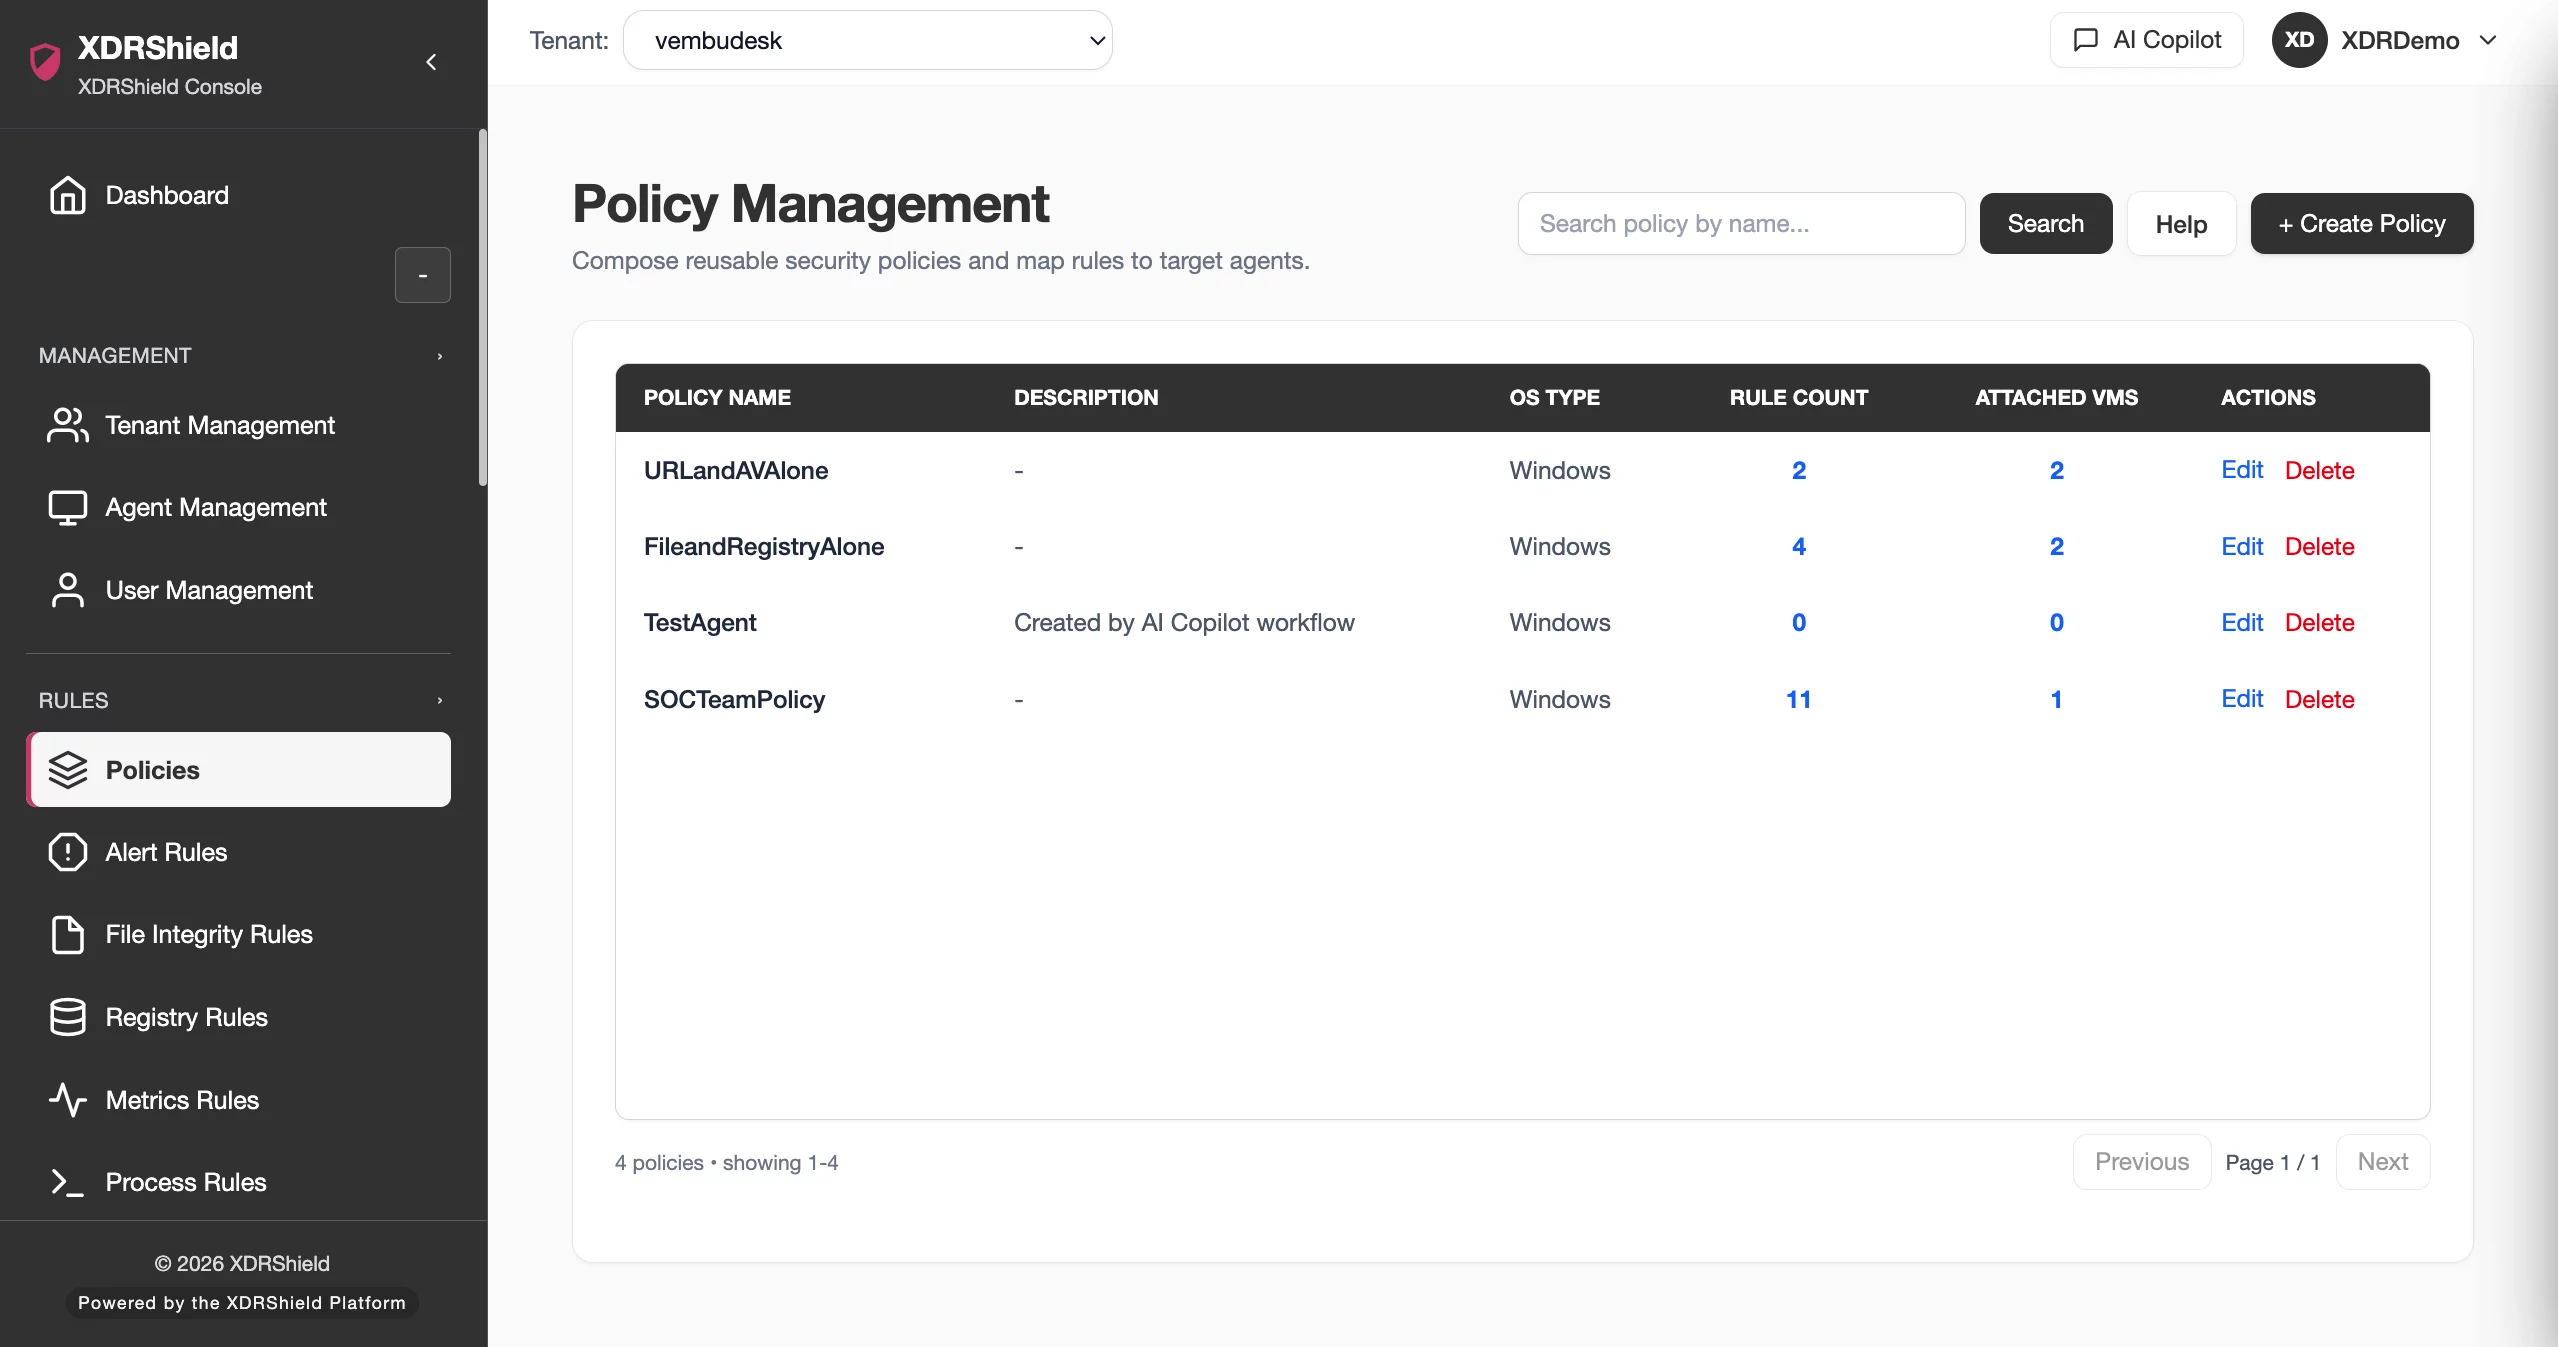
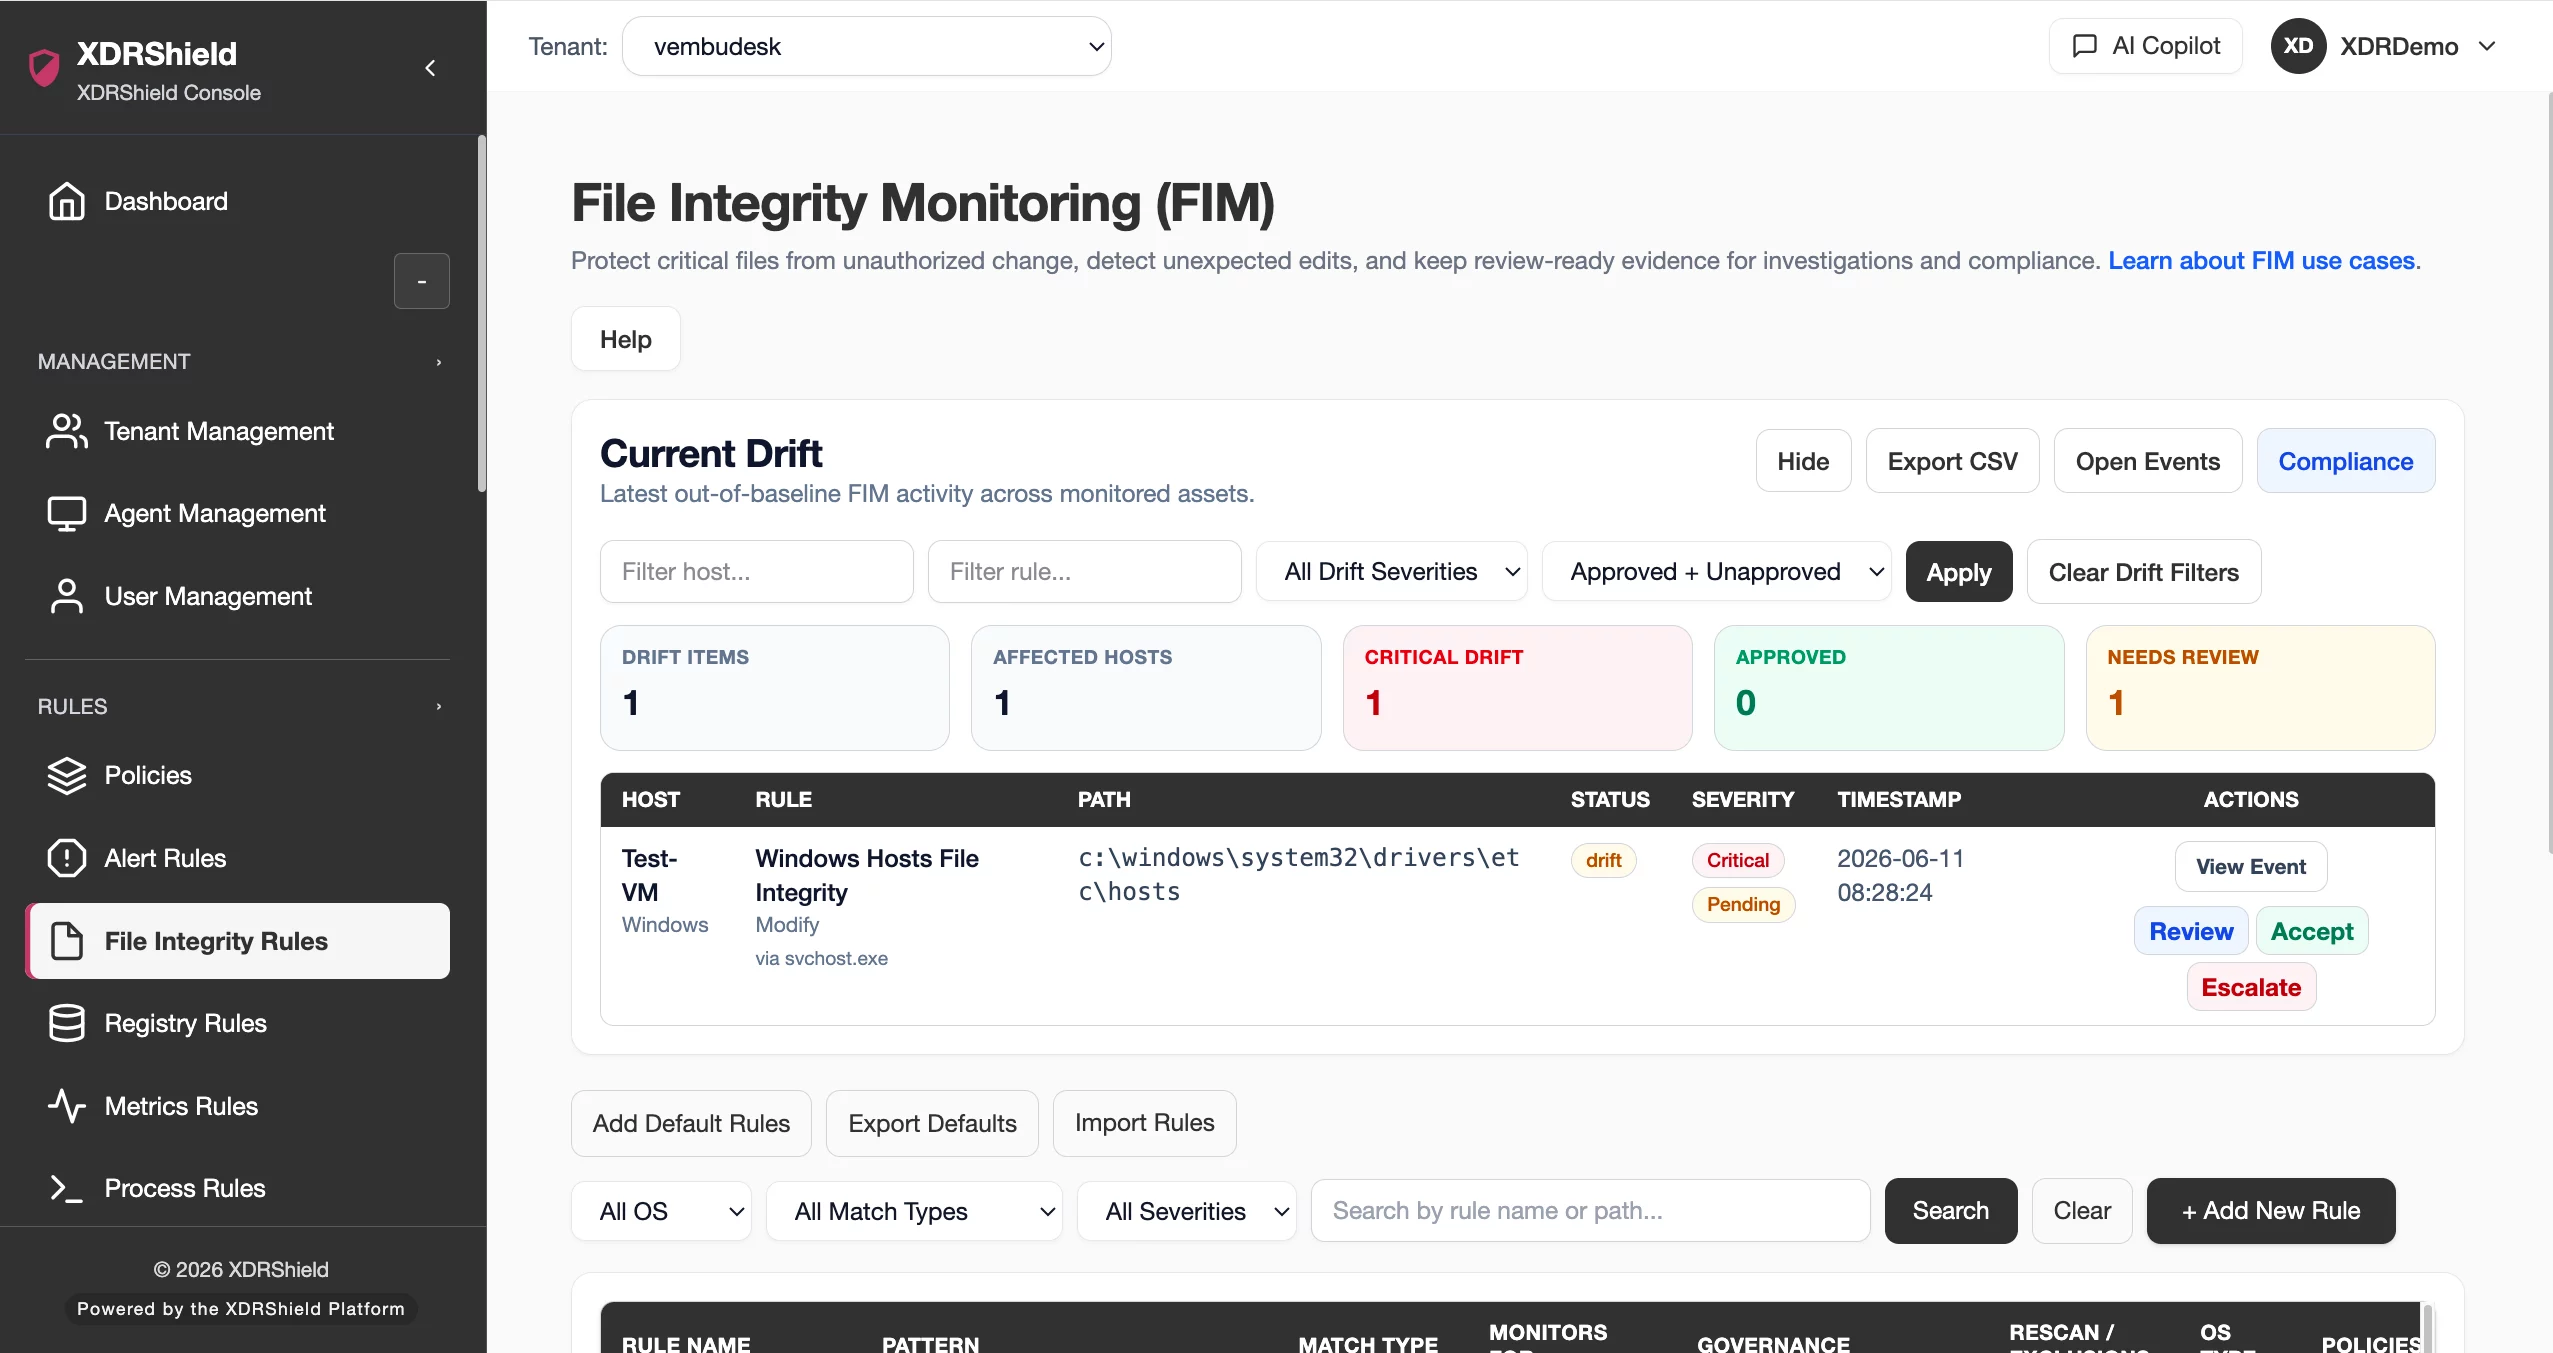
XDRShield agents collect endpoint observations — process activity, file integrity changes, registry modifications, network connections, URL access, IOC matches, and system metrics. These observations flow into the event stream, where they become searchable records with summary cards showing event counts and trends, distribution charts breaking events down by type, agent, and time, and top-agent lists revealing high-volume systems that often explain the biggest changes.
- Agents collect process, file, registry, network, URL, and IOC match observations across monitored endpoints.
- Observations become searchable events with timestamp, endpoint, event type, user, and detail fields.
- Summary cards and distribution charts surface event counts, trends, and breakdowns by type, agent, and time.
- Raw event search supports filtering by user, file path, filename fragments, agent, event type, and time range.
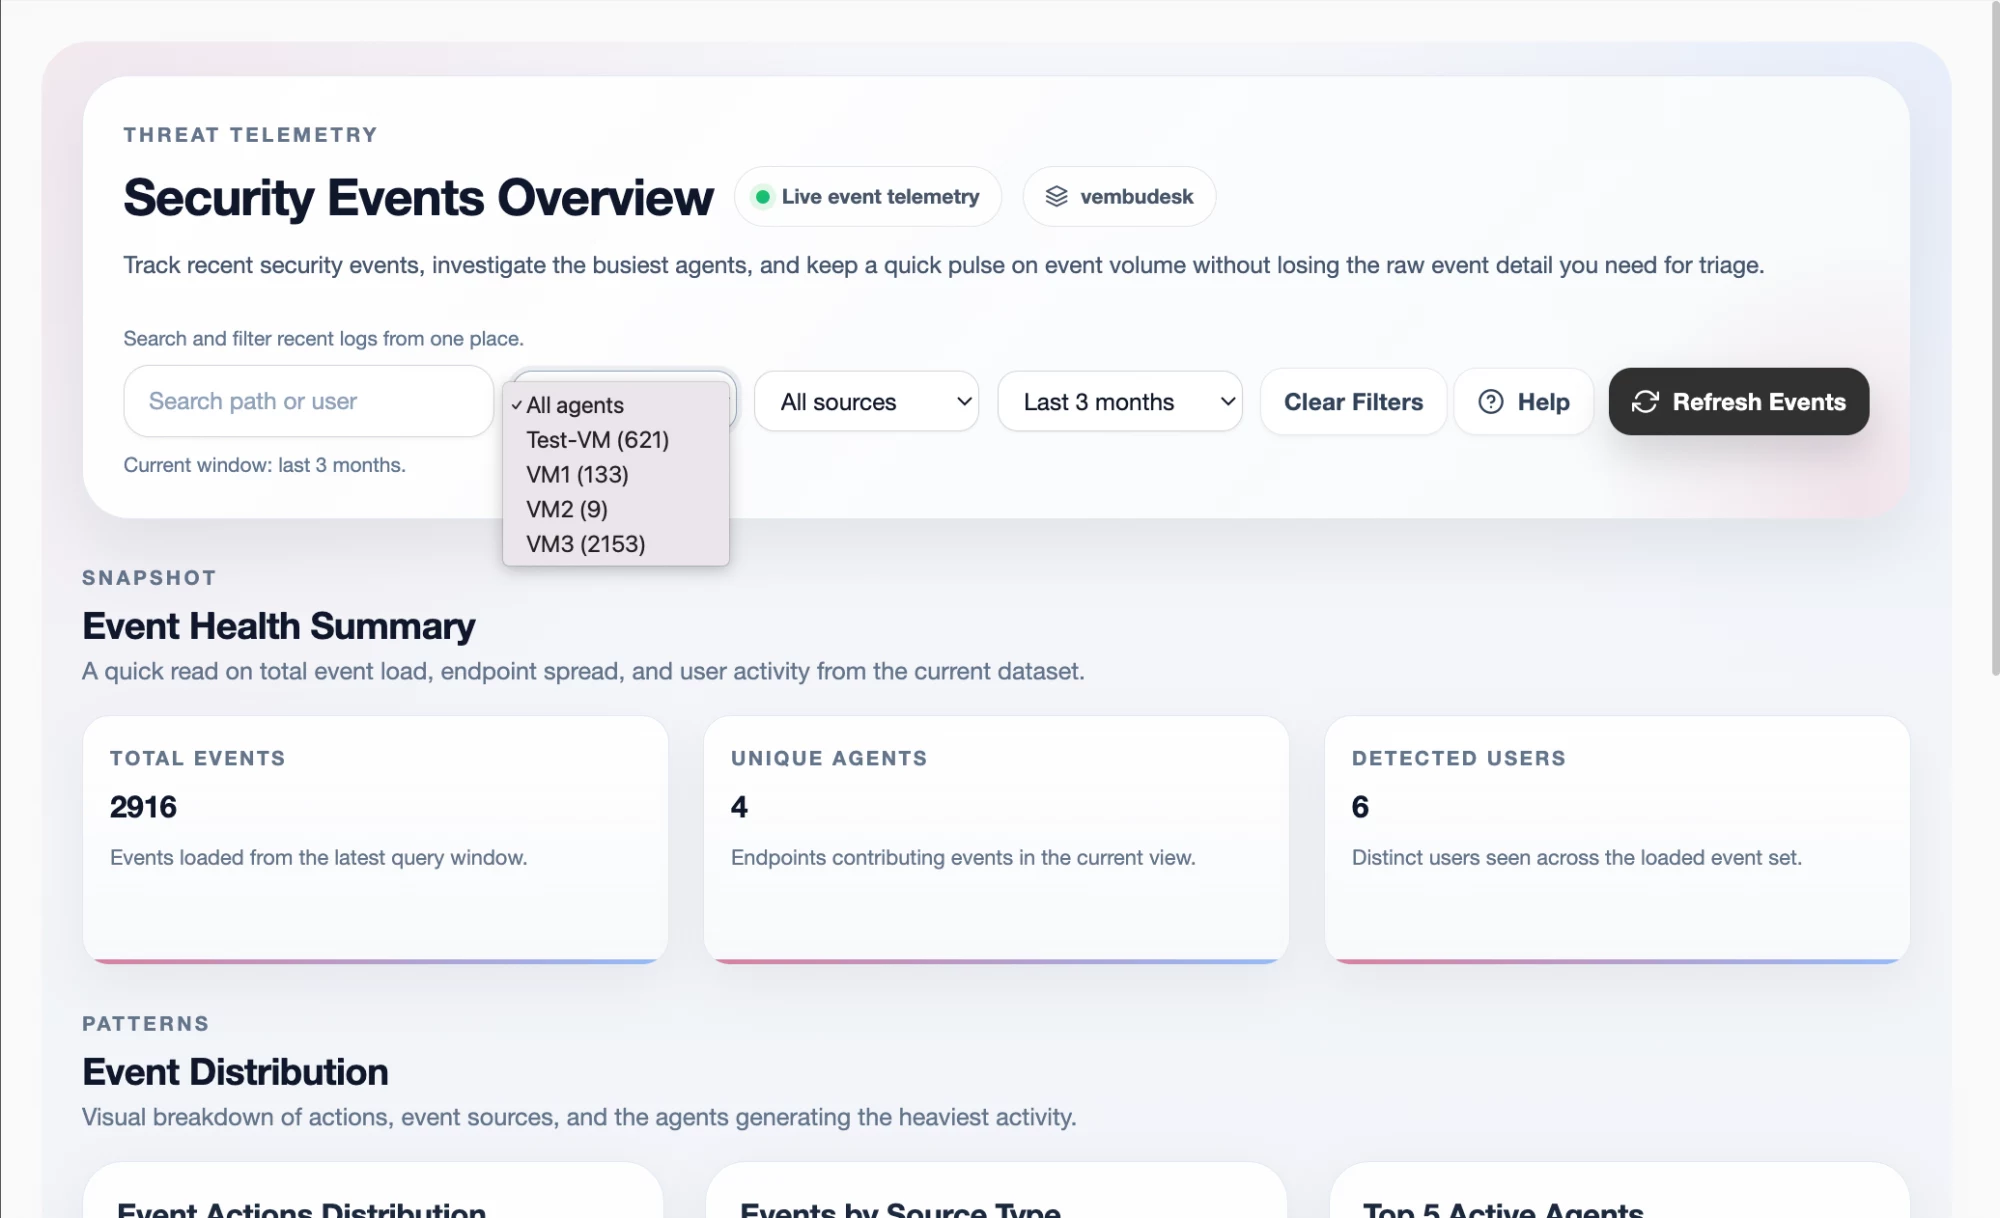
What XDRShield Security Events helps teams do.
Each capability supports event visibility, triage, investigation, and alert correlation so teams can move from summary trends to raw event evidence quickly.
Event summary and trending
Review summary cards showing recent event counts and trend direction so teams can spot spikes, drops, or unusual activity patterns across monitored endpoints.
Distribution breakdowns
Use distribution charts to break events down by type, agent, and time period. Visual breakdowns help identify which event categories and endpoints drive volume changes.
Top agent identification
See which agents generate the most events. High-volume systems often explain the biggest changes and deserve triage priority during investigation.
Raw event search and filtering
Search the raw event log by user, file path, filename fragments, agent, event type, and time range. Narrow searches produce faster triage results than broad queries.
Event-to-alert correlation
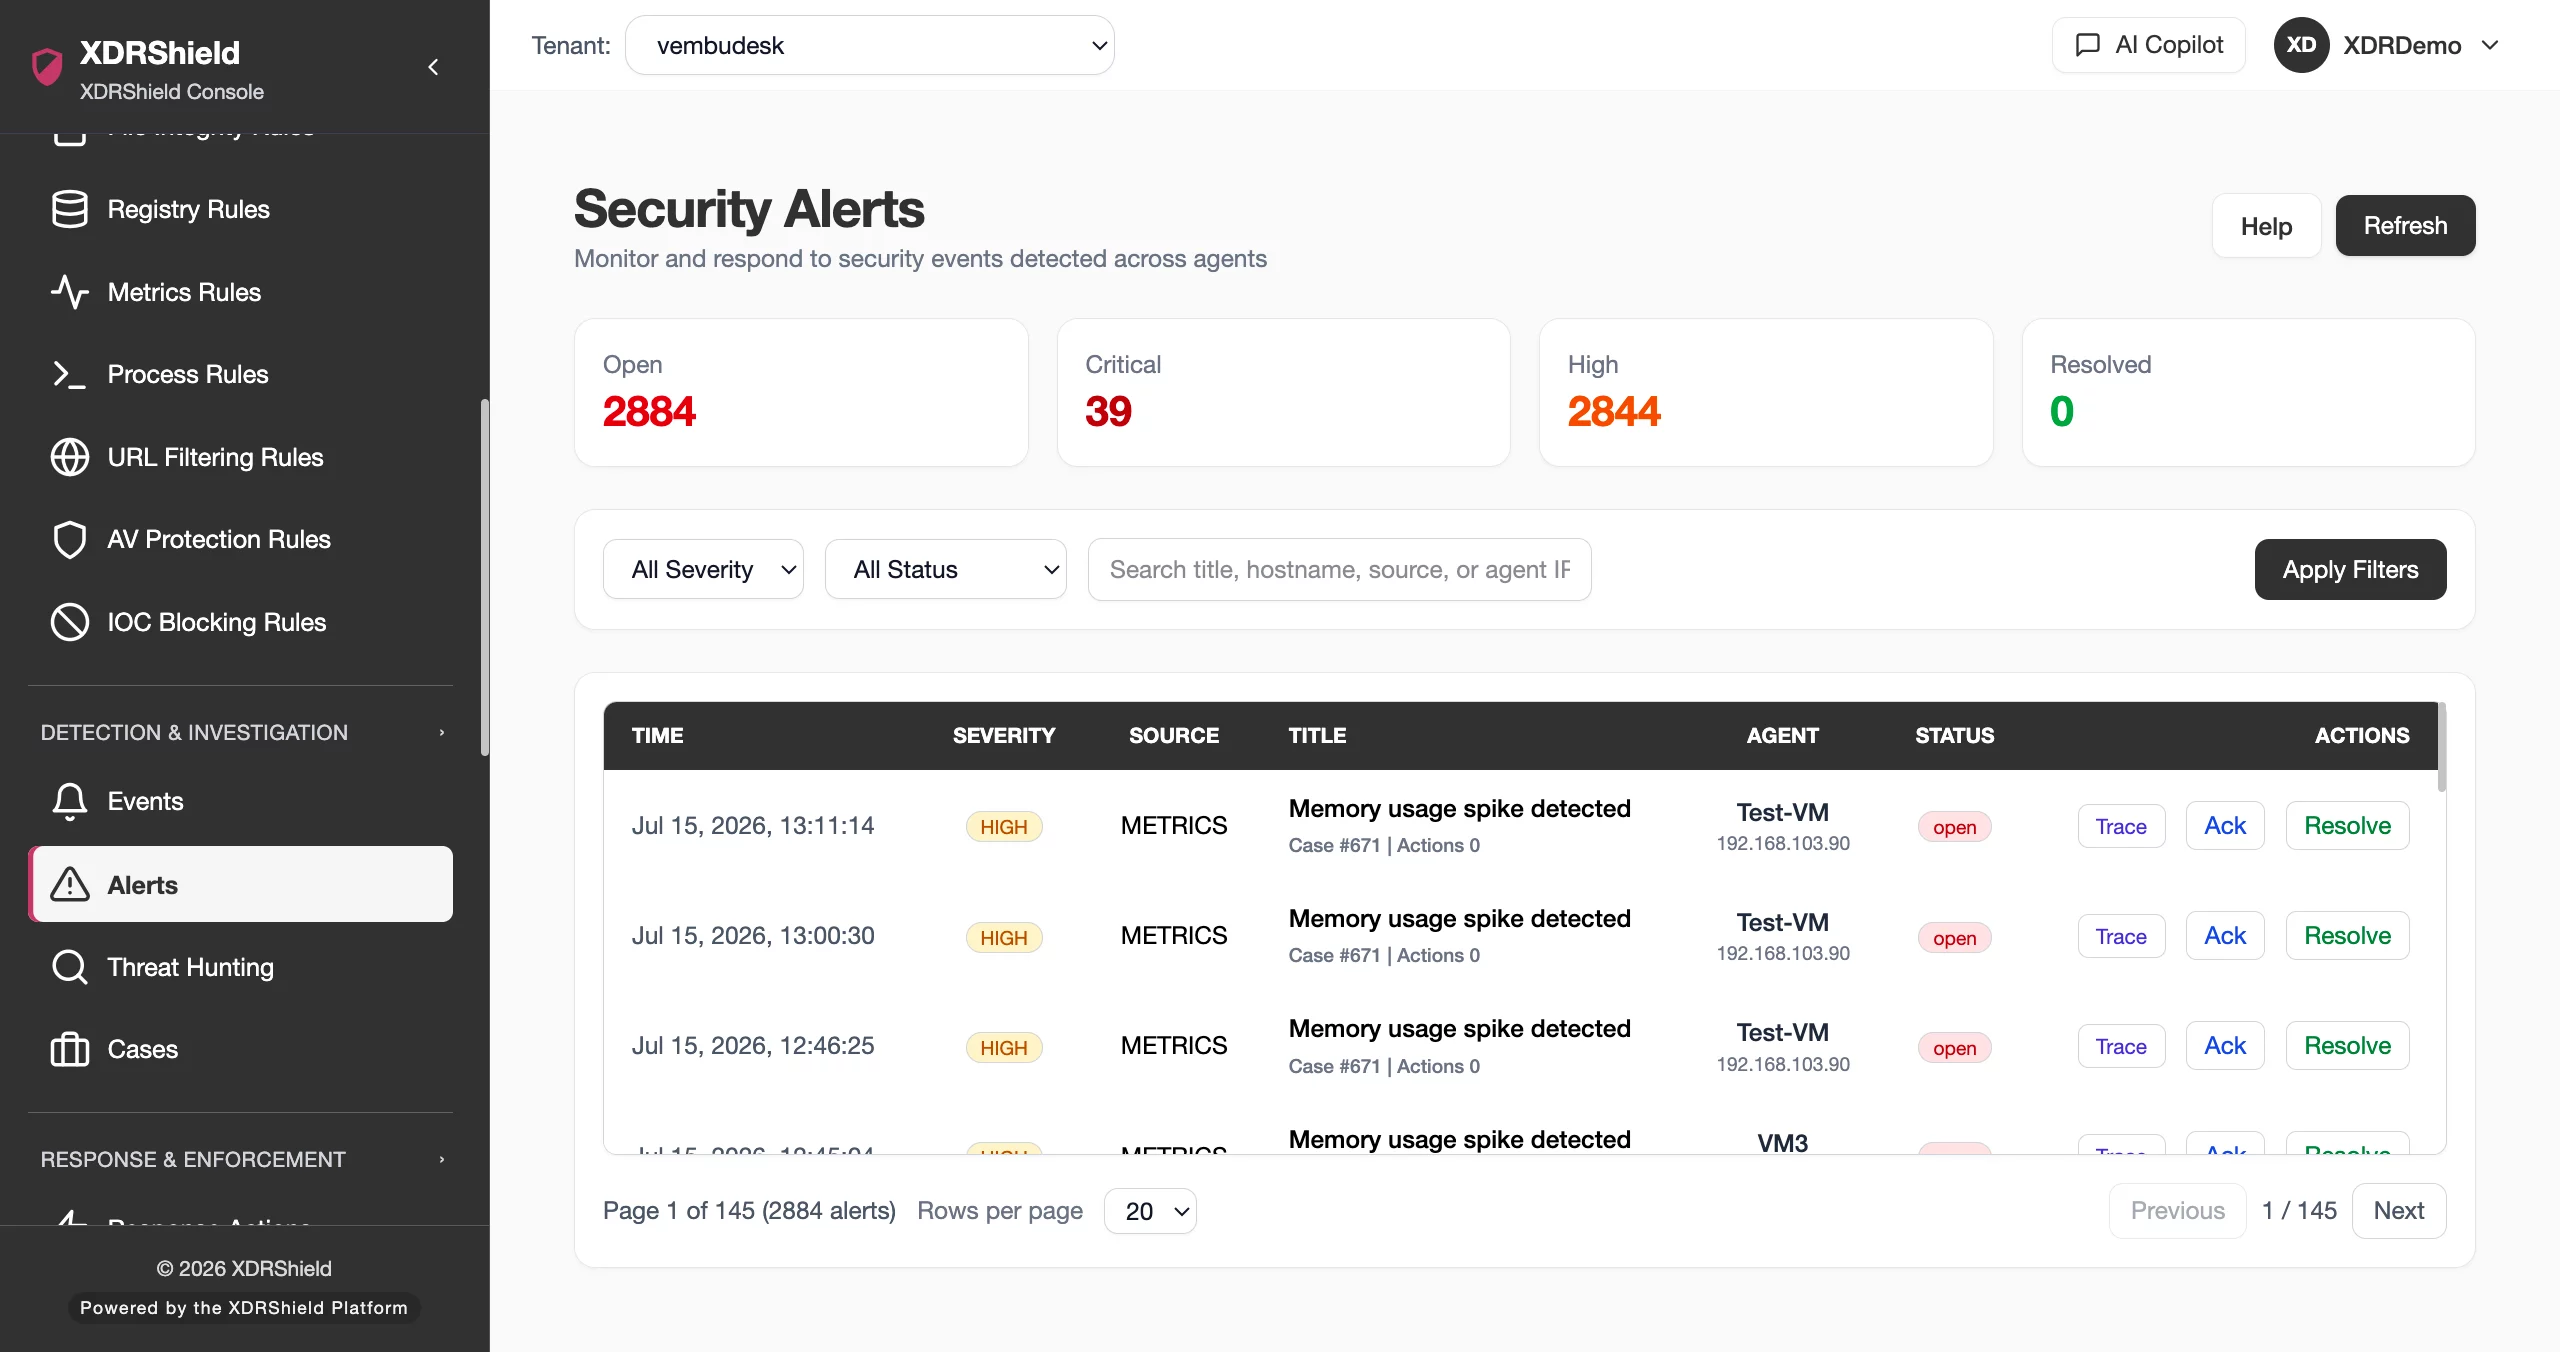
Correlate raw events with security alerts to understand which observations triggered detections and which remained below alert thresholds.
Endpoint telemetry ingestion
Agents collect process activity, file integrity changes, registry modifications, network connections, URL access, IOC matches, and system metrics as searchable events.
Evidence freshness and recency
Summary cards and event timestamps show how current the telemetry is. Fresh evidence supports faster triage and more confident investigation decisions.
Event history and retention
Retained event history supports post-incident review, compliance evidence collection, and historical investigation throughout the configured retention period.
What’s the difference between Security Events and Security Alerts?
Security Events are all collected endpoint observations. Security Alerts are the subset of events that matched detection rules and were promoted to actionable alerts. Understanding the difference helps teams use each view correctly.
From summary review to raw event search and alert correlation.
A structured event workflow keeps triage repeatable. Start with summary trends, check distributions, identify noisy agents, search raw events, correlate with alerts, and escalate or close.
Review summary cards
Check event count cards and trend indicators to see whether current activity is within normal ranges or has spiked.
Check distribution charts
Review event breakdowns by type, agent, and time to identify which categories or periods show unusual patterns.
Identify noisy agents
Use top-agent lists to find endpoints generating the most events. High-volume systems often explain the biggest changes.
Search raw events
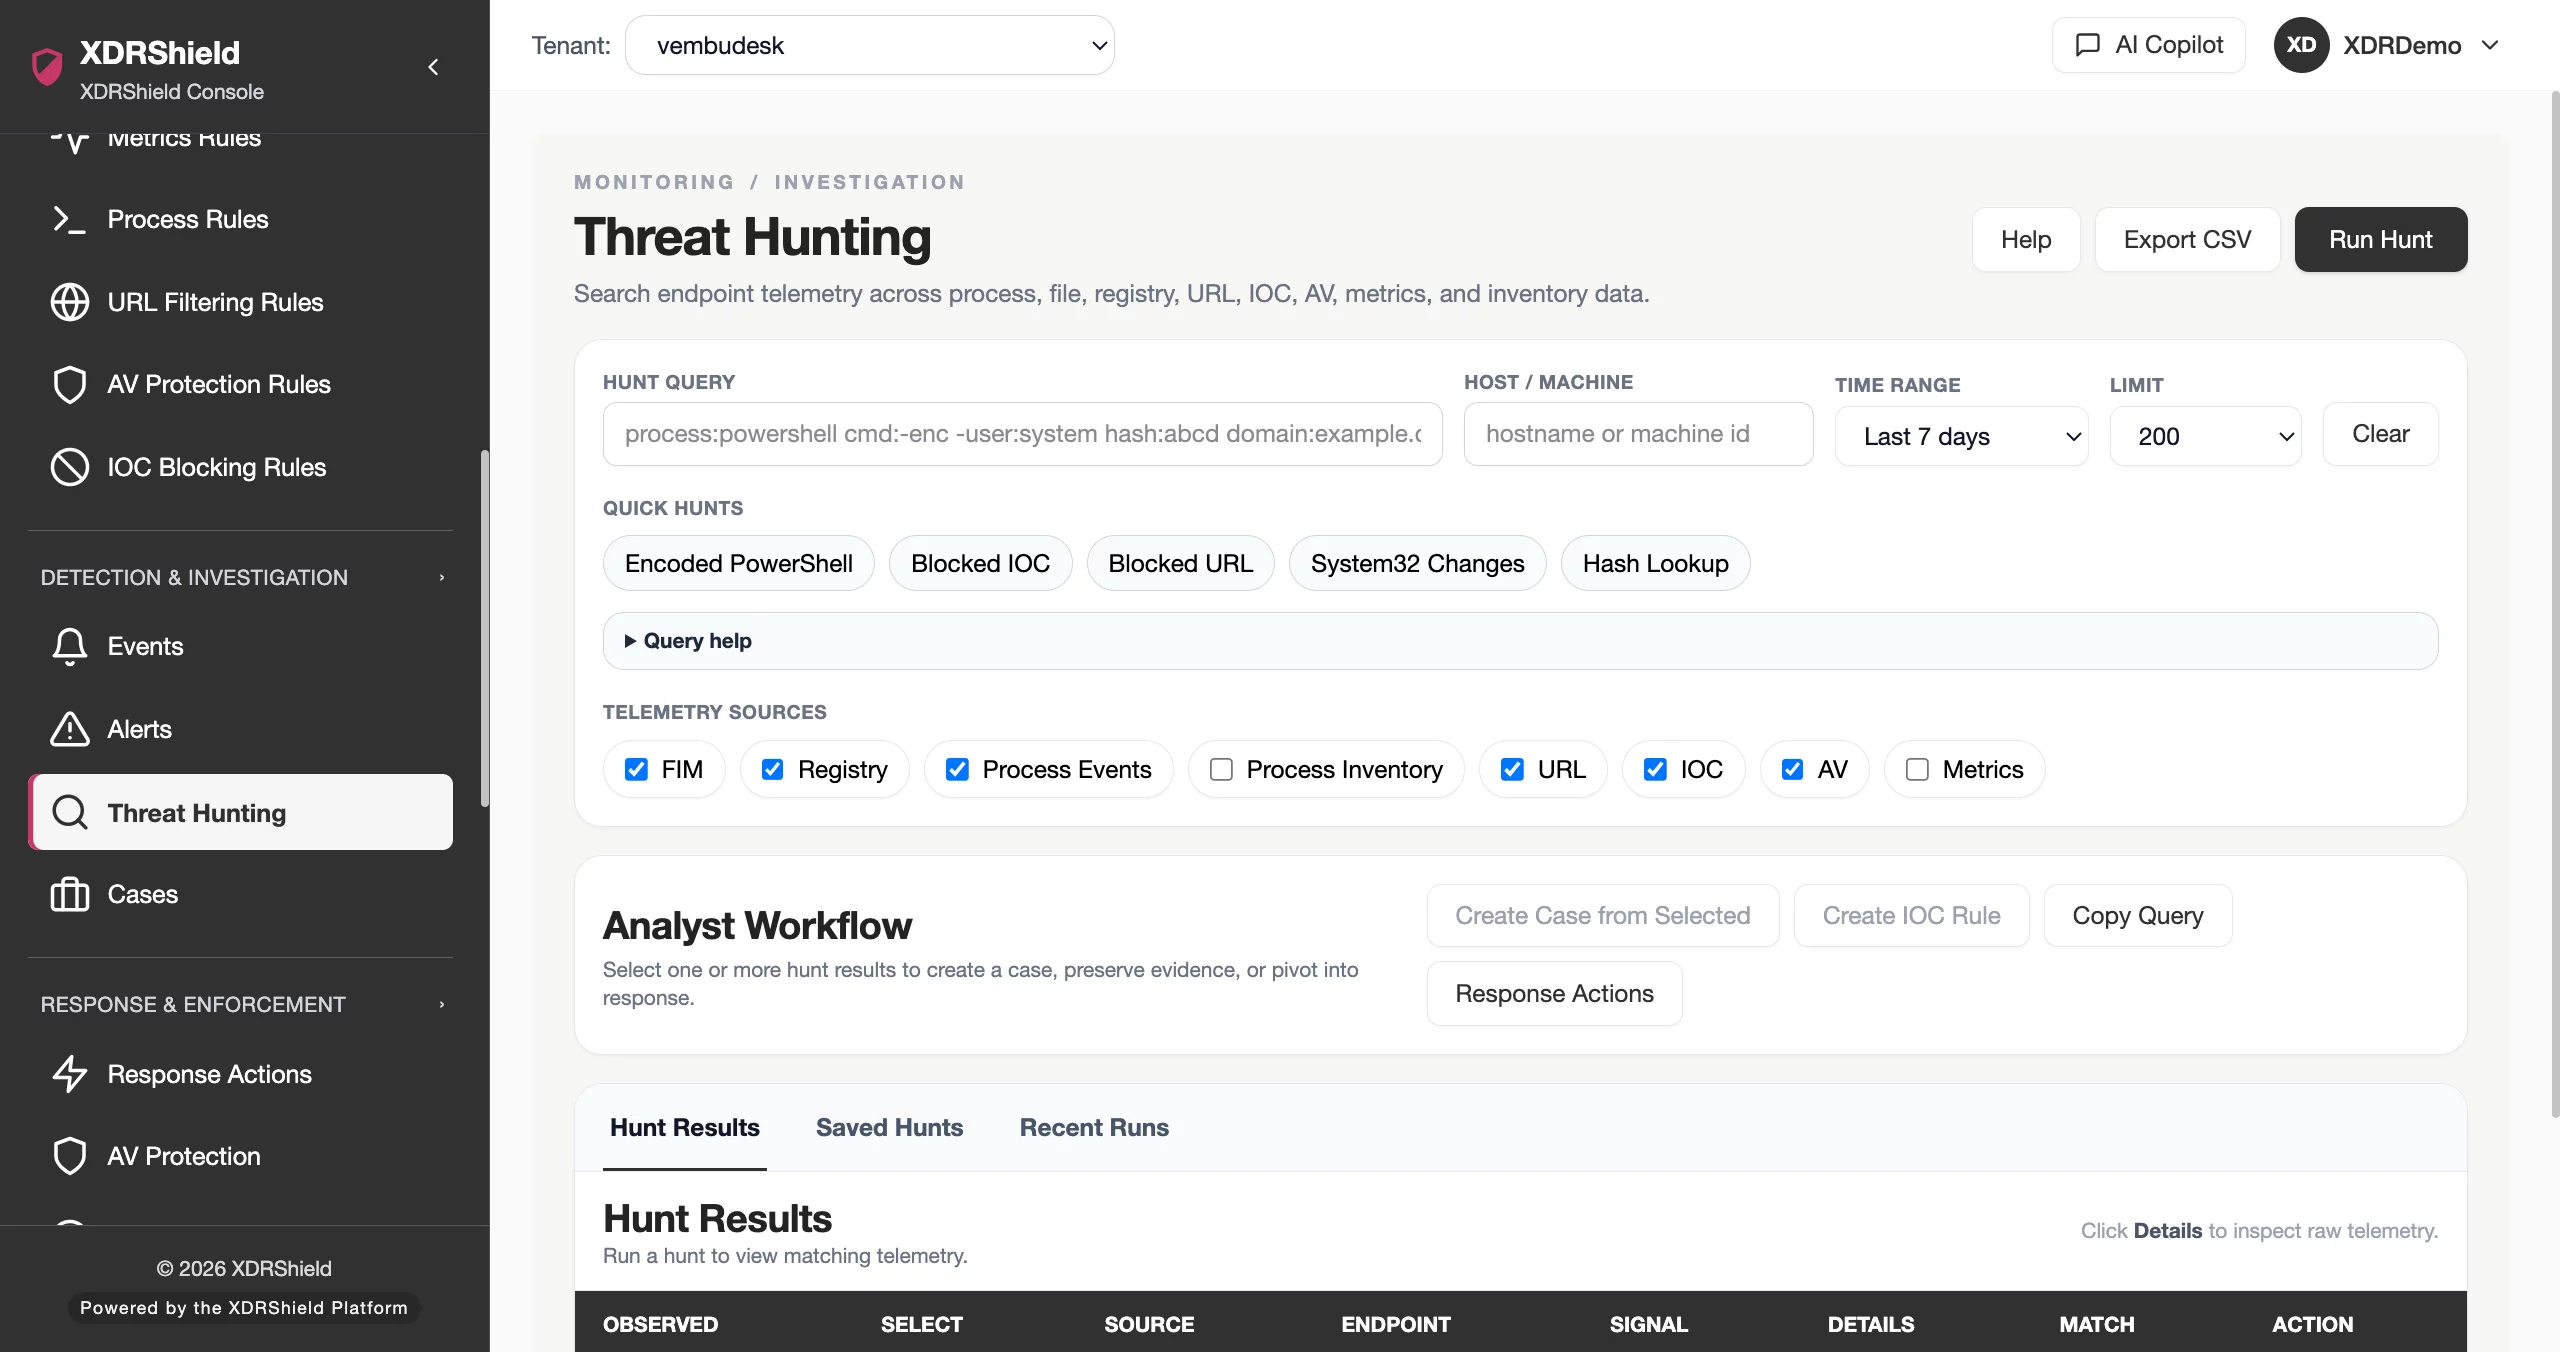
Use raw event search with filters for user, file path, filename fragments, agent, event type, and time range for precise triage.
Correlate with alerts
Compare events with security alerts to understand which observations triggered detections and which did not.
Escalate or close
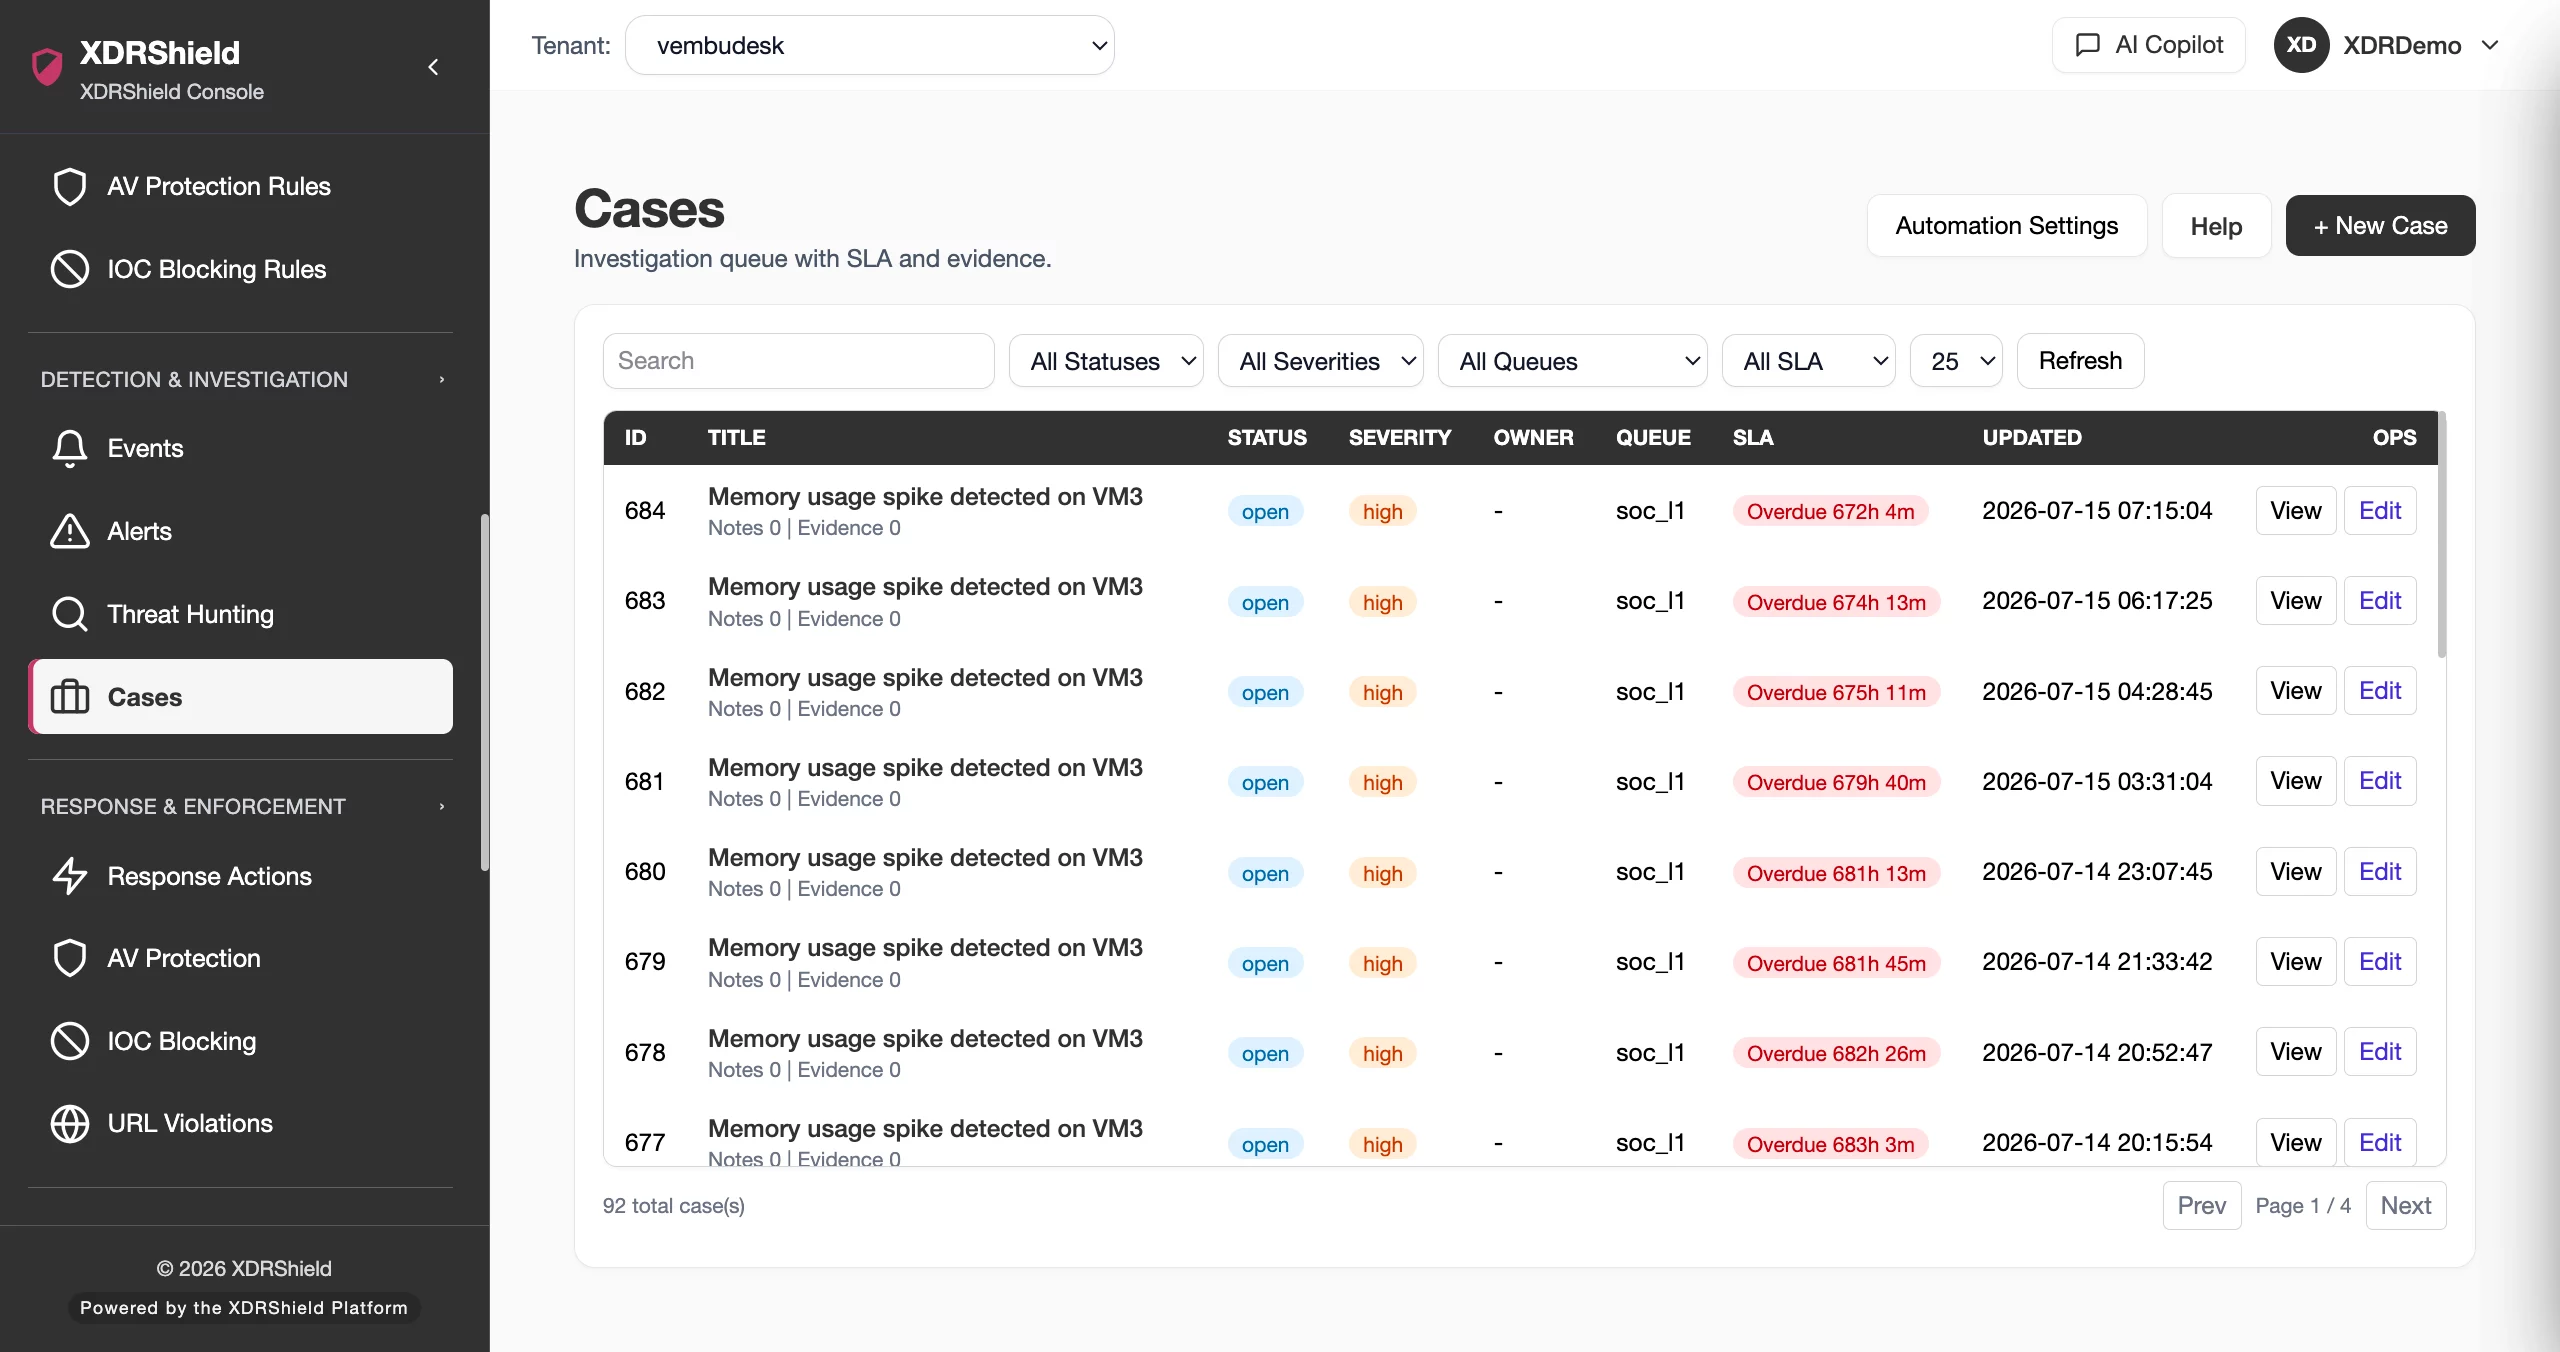
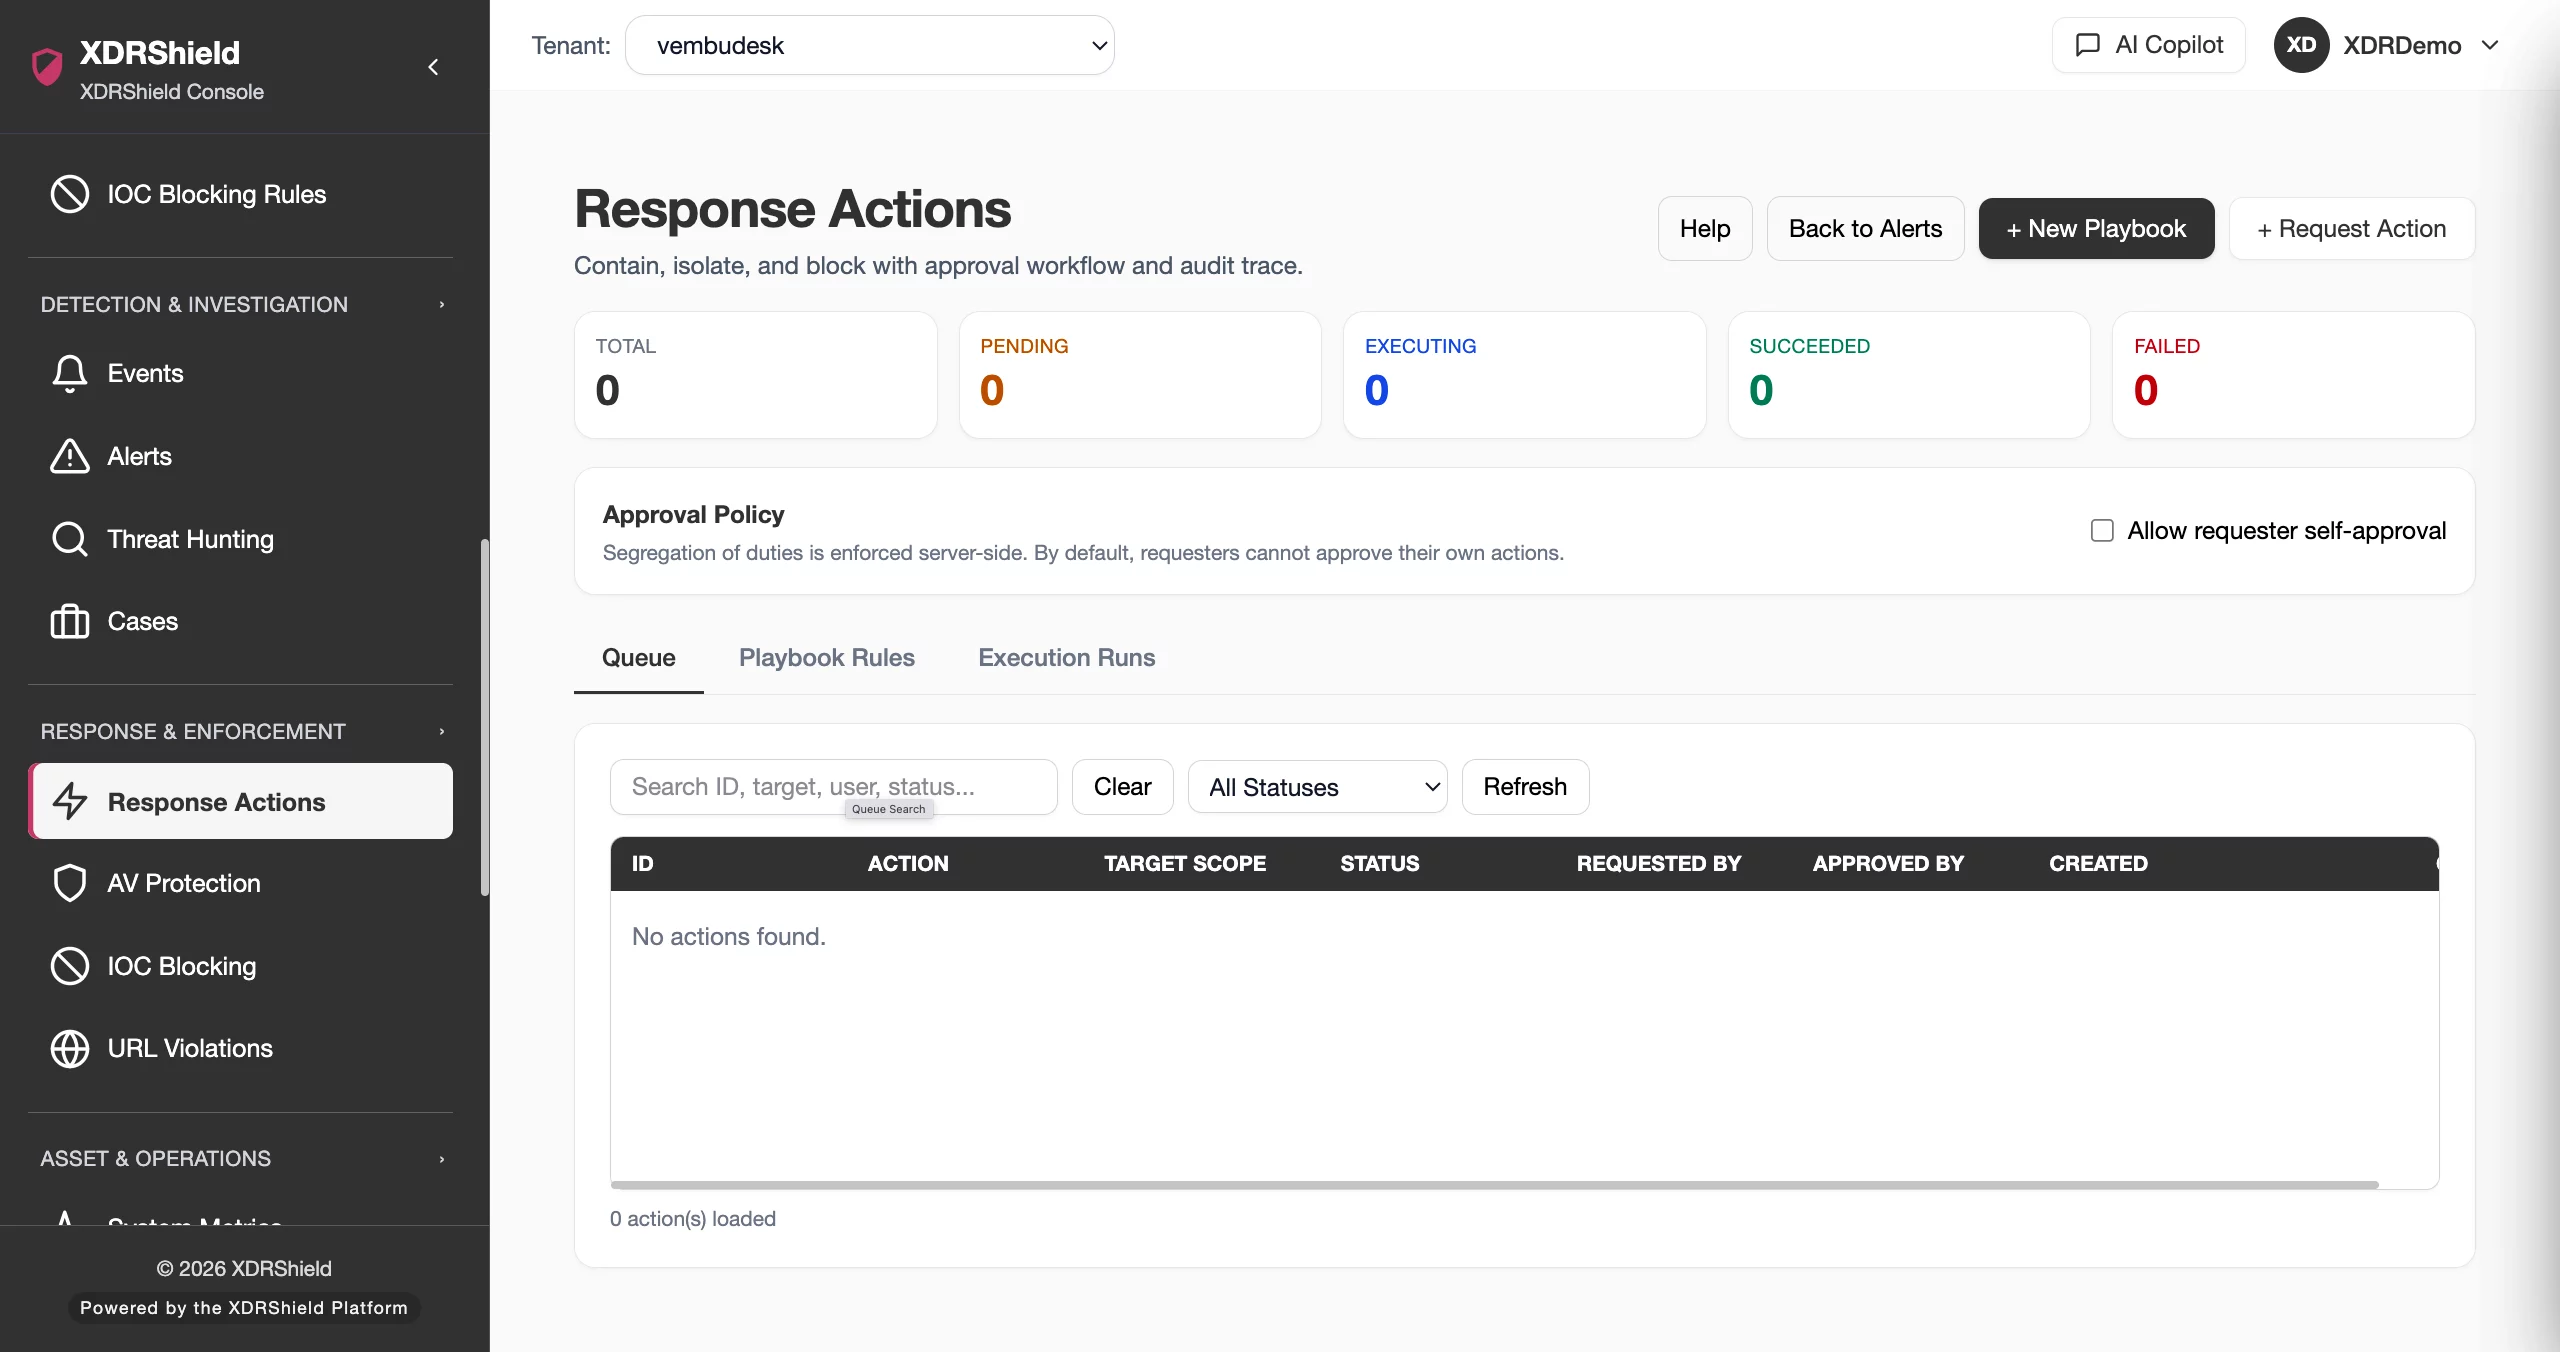
Escalate findings into hunts, cases, or response actions. Close routine observations that do not warrant further investigation.
Where Security Events helps most.
Security events support investigation, triage, compliance, and operational monitoring across endpoints, agents, and tenants.
Triage acceleration
Use summary cards and distribution charts to quickly assess event volume and prioritize which endpoints or event types need investigation first.
Noisy endpoint identification
Top-agent lists reveal which systems generate the most events, helping teams spot misconfigured software, compromised hosts, or policy gaps.
Post-incident evidence review
After an incident, search the raw event log to reconstruct what happened on each endpoint with timestamped, detailed observations.
Alert validation
Correlate alerts with underlying raw events to confirm detection accuracy, understand trigger context, and reduce false-positive noise.
Compliance evidence collection
Export or reference retained event history to demonstrate endpoint monitoring coverage for audits, reviews, and regulatory requirements.
MSP tenant event monitoring
Managed service providers can monitor event trends across customer tenants, keeping tenant-specific event data separate and searchable.
Security Events for SOC, investigation, and MSP teams.
The same event data supports different decisions. XDRShield keeps summary trends, raw search, and correlation available without losing tenant scope or investigative depth.
For SOC and investigation teams
Use security events to investigate alerts, reconstruct endpoint timelines, validate detection accuracy, and escalate findings into hunts, cases, and governed response.
- Correlate raw events with alerts for investigation context.
- Search by user, file path, or filename to triage specific indicators.
- Escalate event findings into threat hunting and case workflows.
For MSP and IT operations teams
Monitor event trends across managed tenants, identify noisy endpoints per customer, and keep tenant-specific event data separate and searchable.
- Track event volume and trends across customer tenants.
- Keep tenant-specific event data and search results separate.
- Use event evidence for customer reporting and compliance proof.
Security Events FAQs.
What are Security Events in XDRShield?
Security Events provide recent endpoint telemetry, trending patterns, and the raw event stream needed for investigation and triage. Events include process activity, file changes, network connections, registry modifications, and other endpoint observations collected by the agent.
How do Security Events differ from Security Alerts?
Security Events are all collected endpoint observations. Security Alerts are a subset of events that matched detection rules and were promoted to actionable alerts. Events provide investigative depth while alerts focus operational attention on matched findings.
How do I search Security Events?
Use the raw event search with filters for user, file path, filename fragments, agent, event type, and time range. Narrow searches produce faster triage results than broad queries.
What telemetry sources feed Security Events?
XDRShield agents collect process activity, file integrity changes, registry modifications, network connections, URL access, IOC matches, and system metrics. All collected observations appear as events for search, triage, and correlation.
How long are Security Events retained?
Event retention depends on tenant configuration and storage allocation. Events remain available for search, investigation, compliance evidence, and historical review throughout the configured retention period.
Use XDRShield Security Events to investigate endpoint telemetry and correlate raw events with alerts.
Review event trends, identify noisy agents, search raw event logs, and correlate observations with alerts for faster triage and stronger evidence.