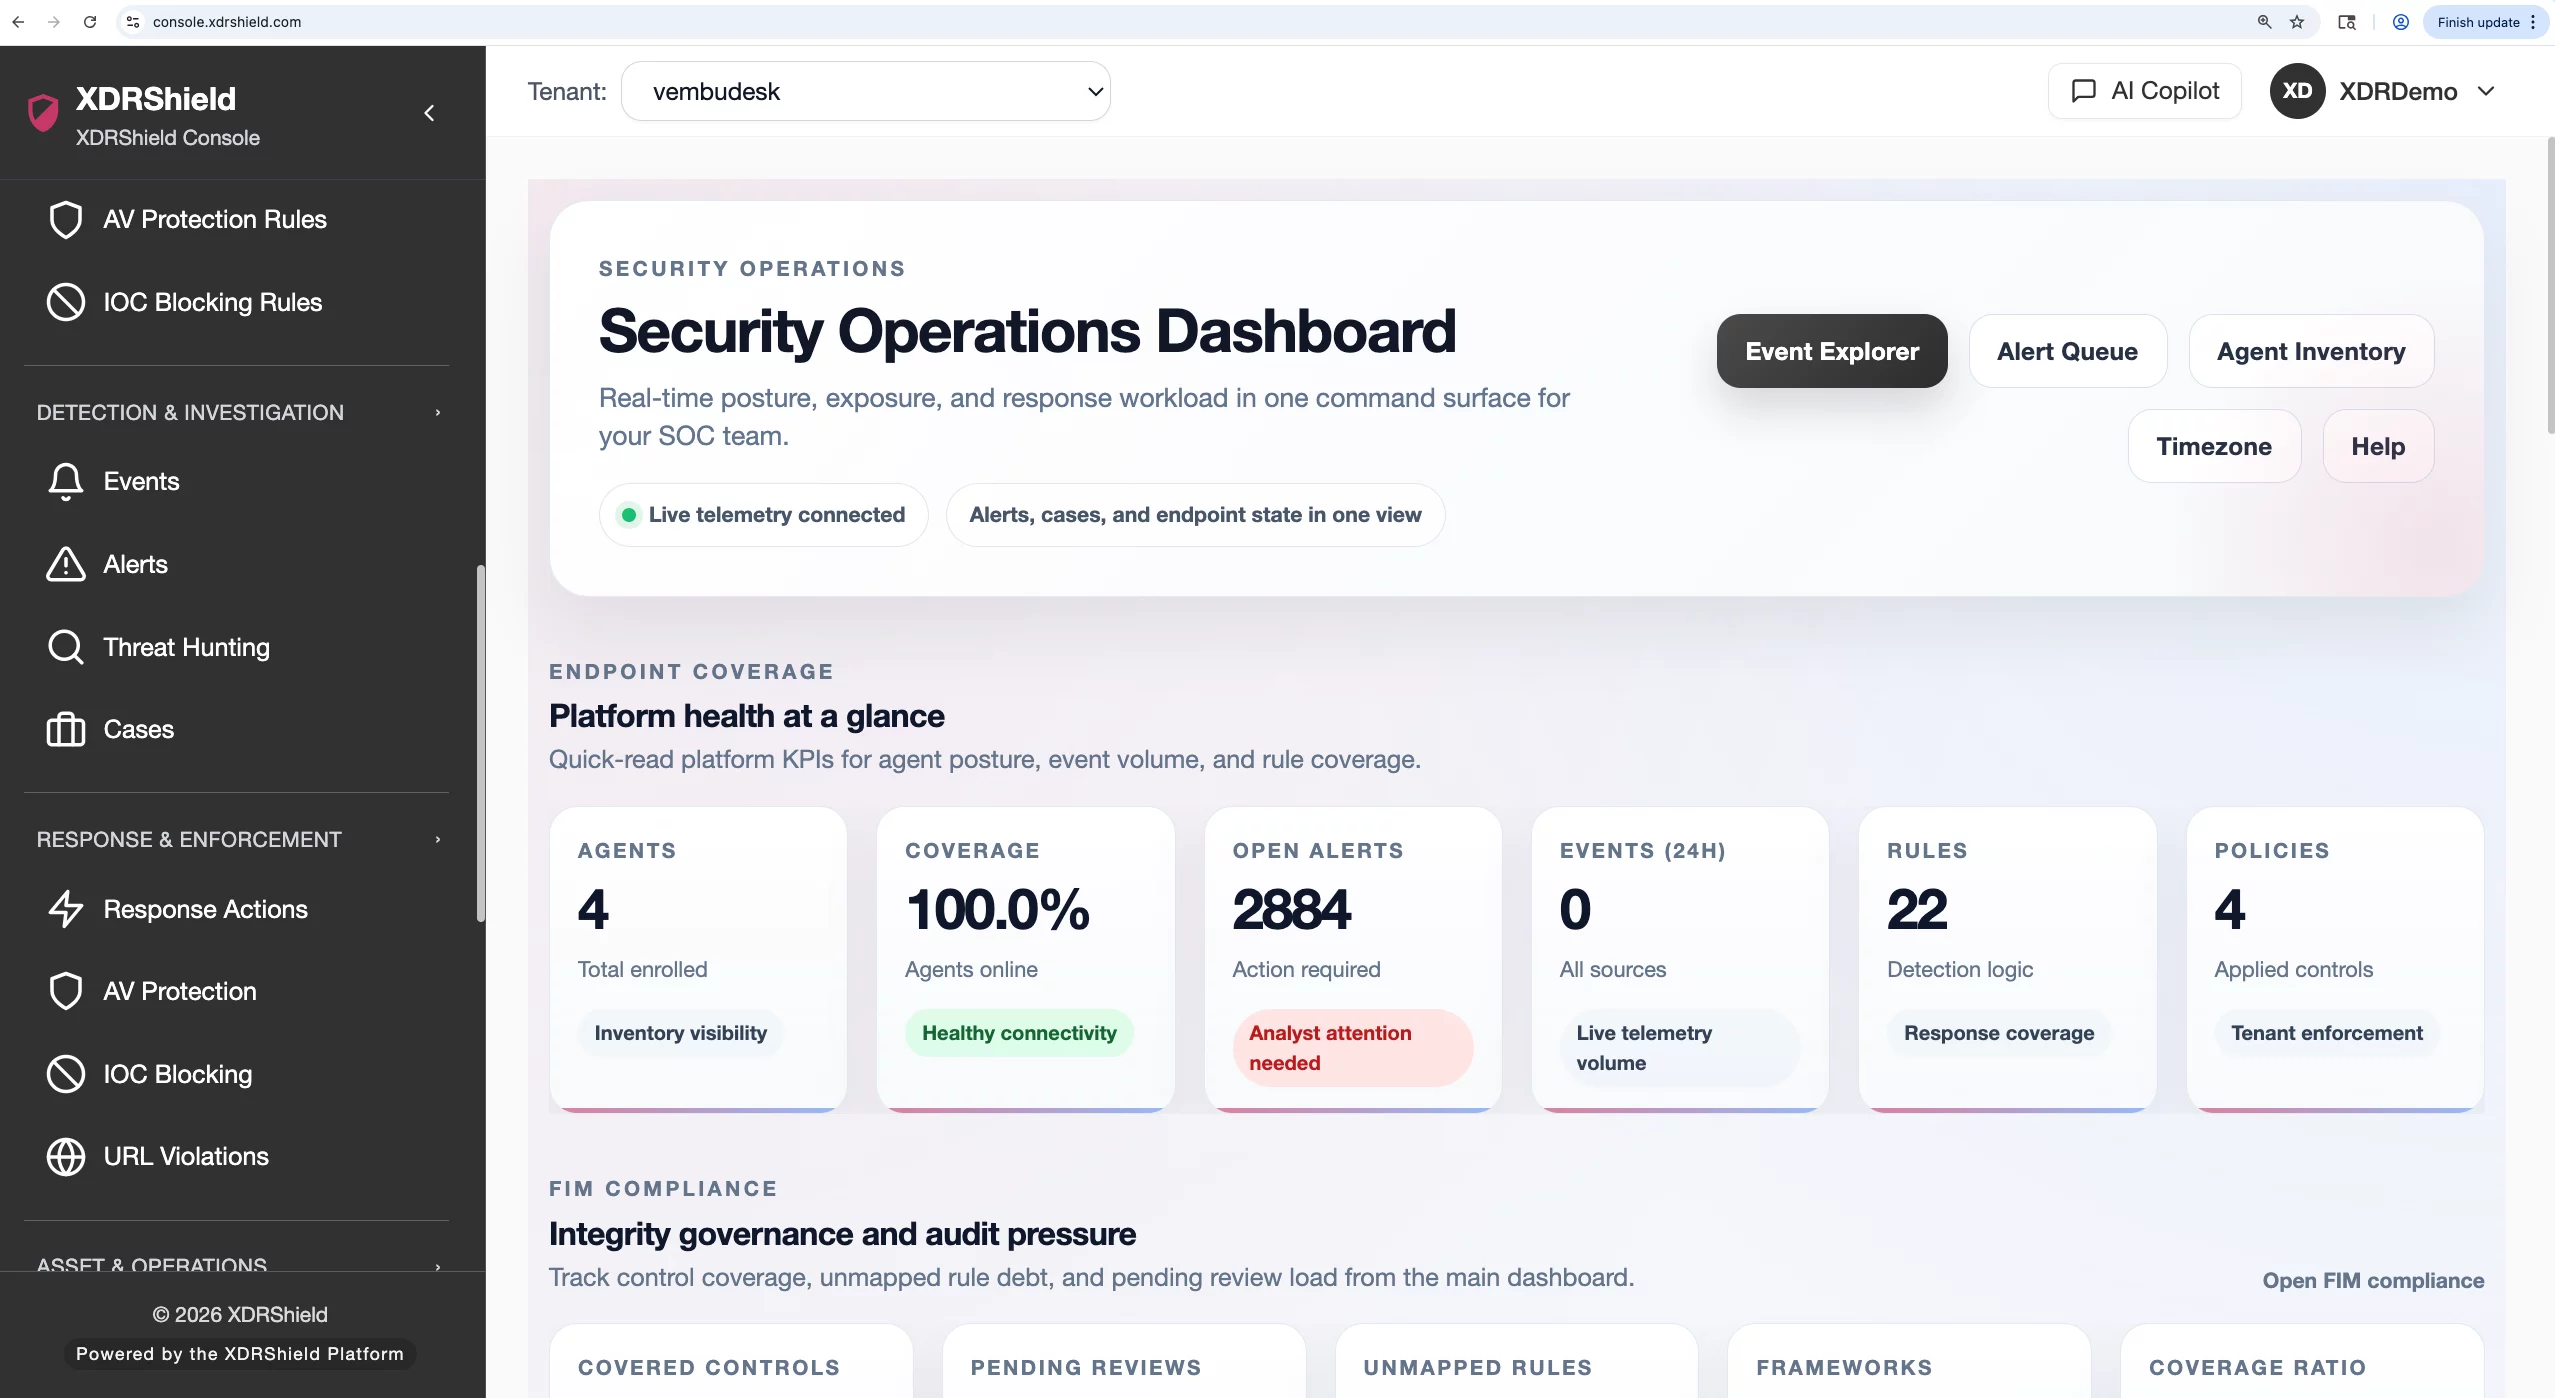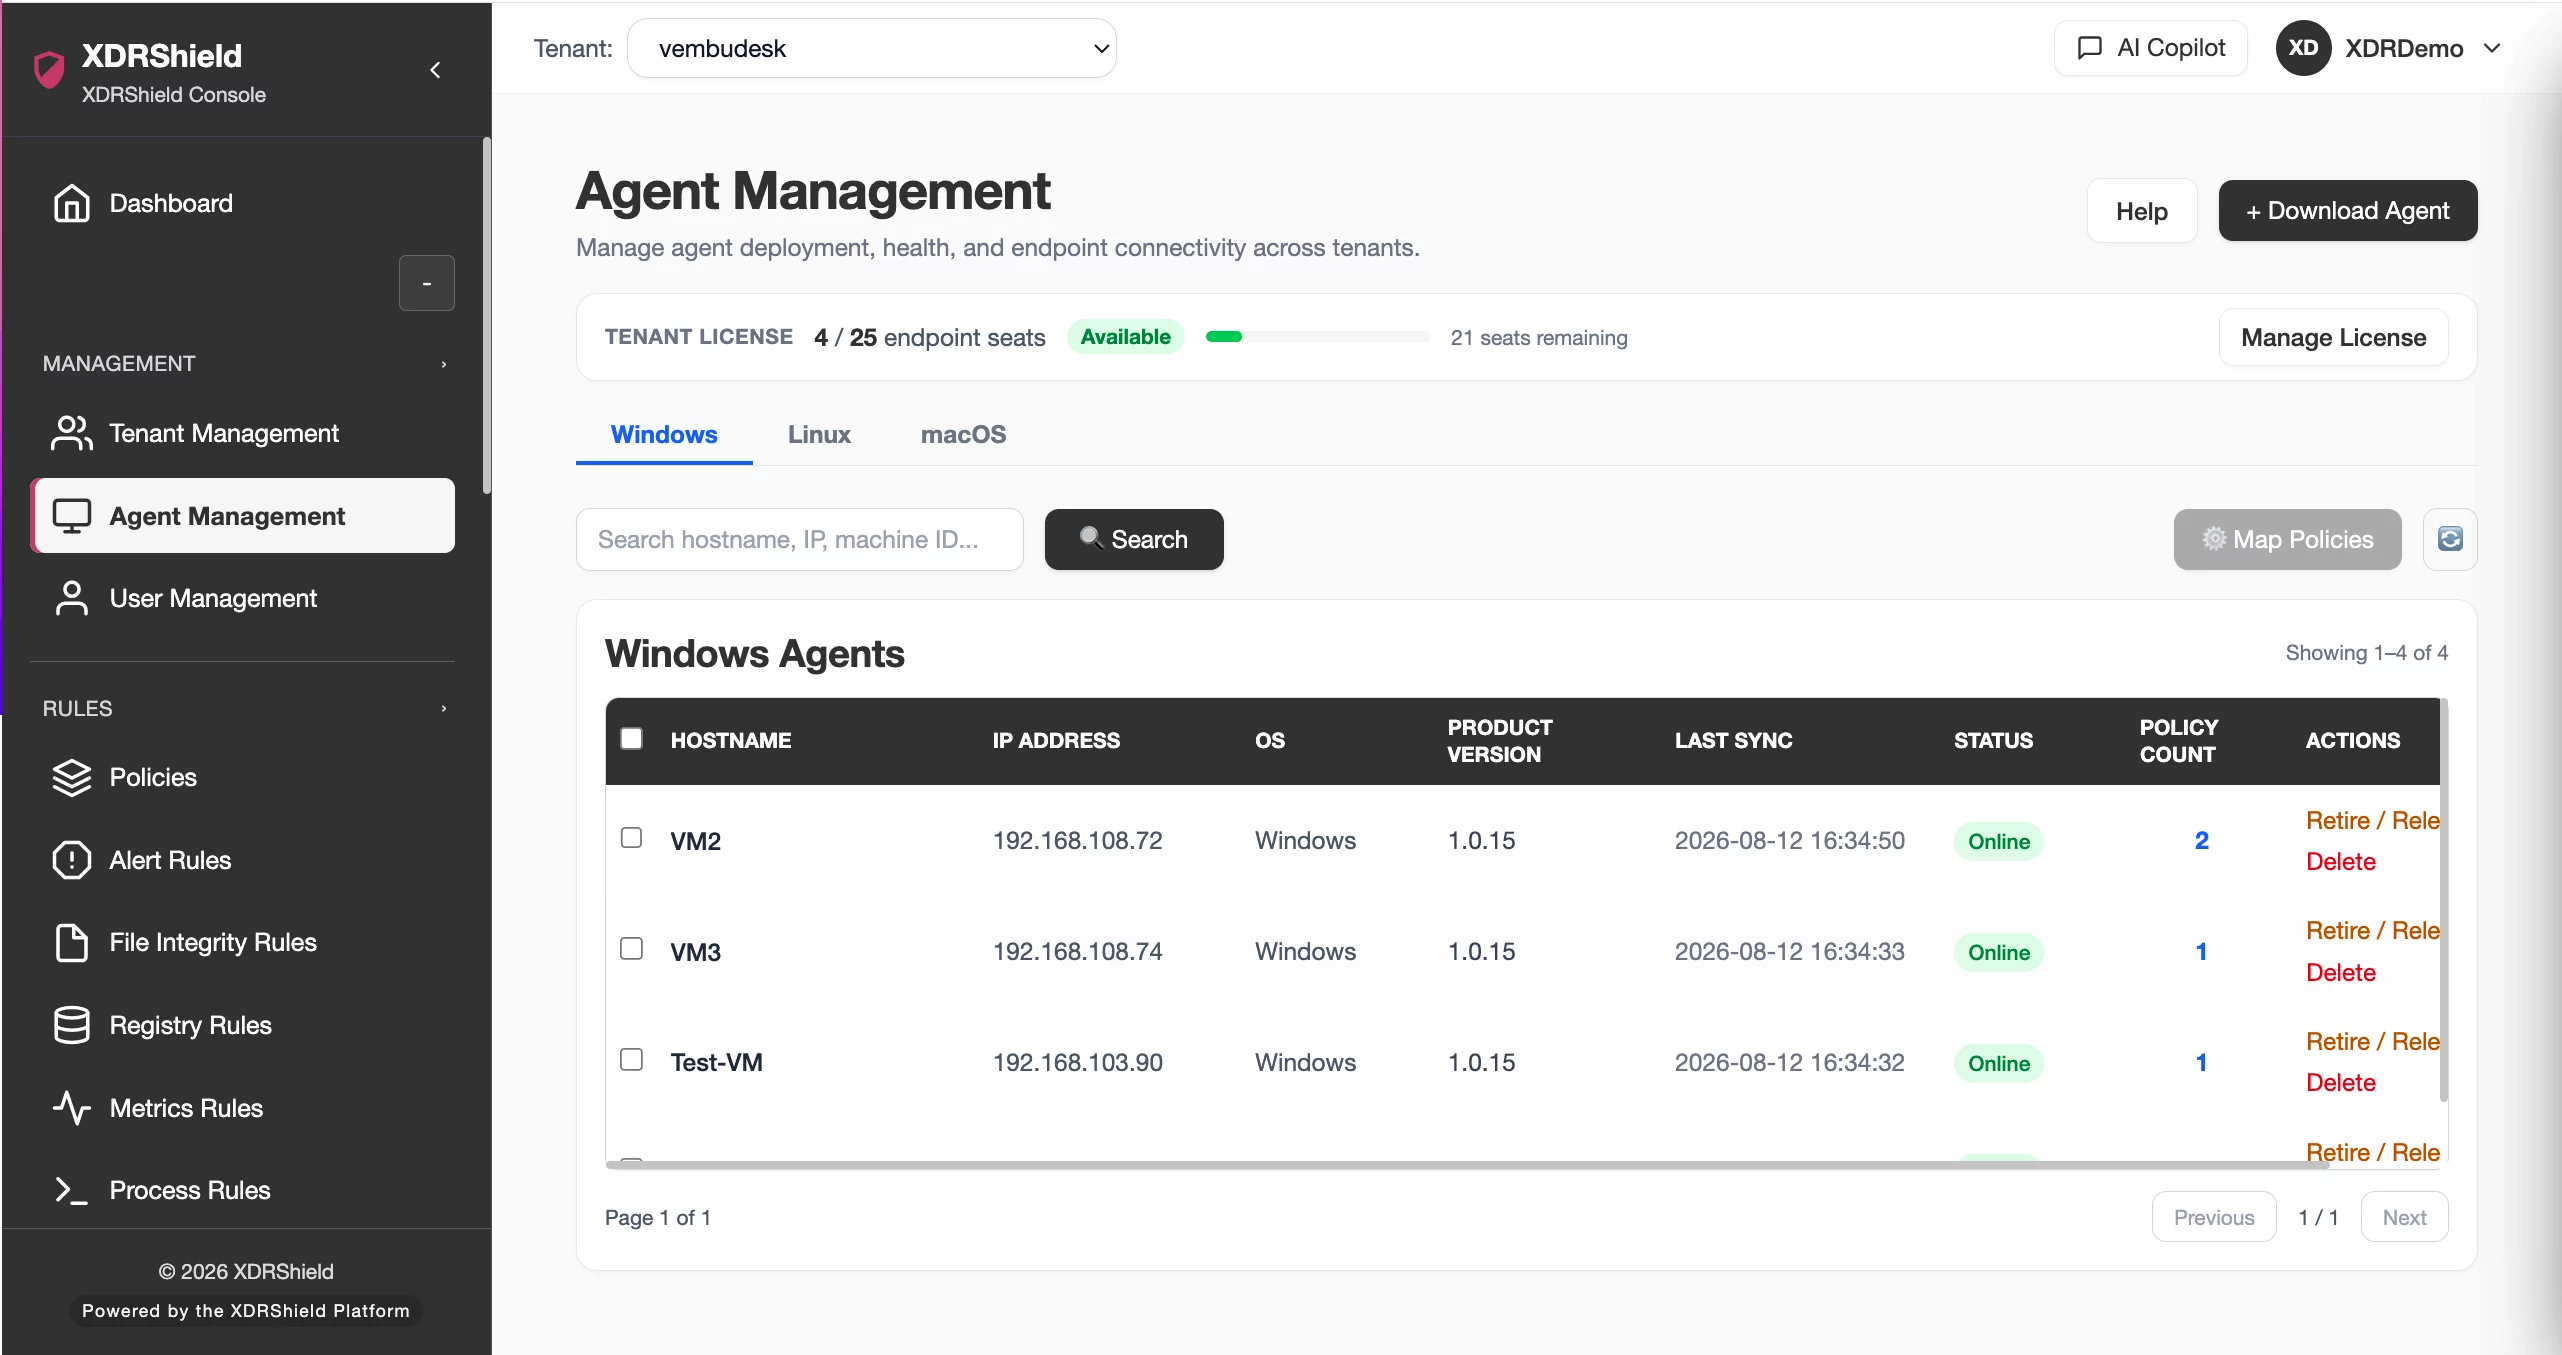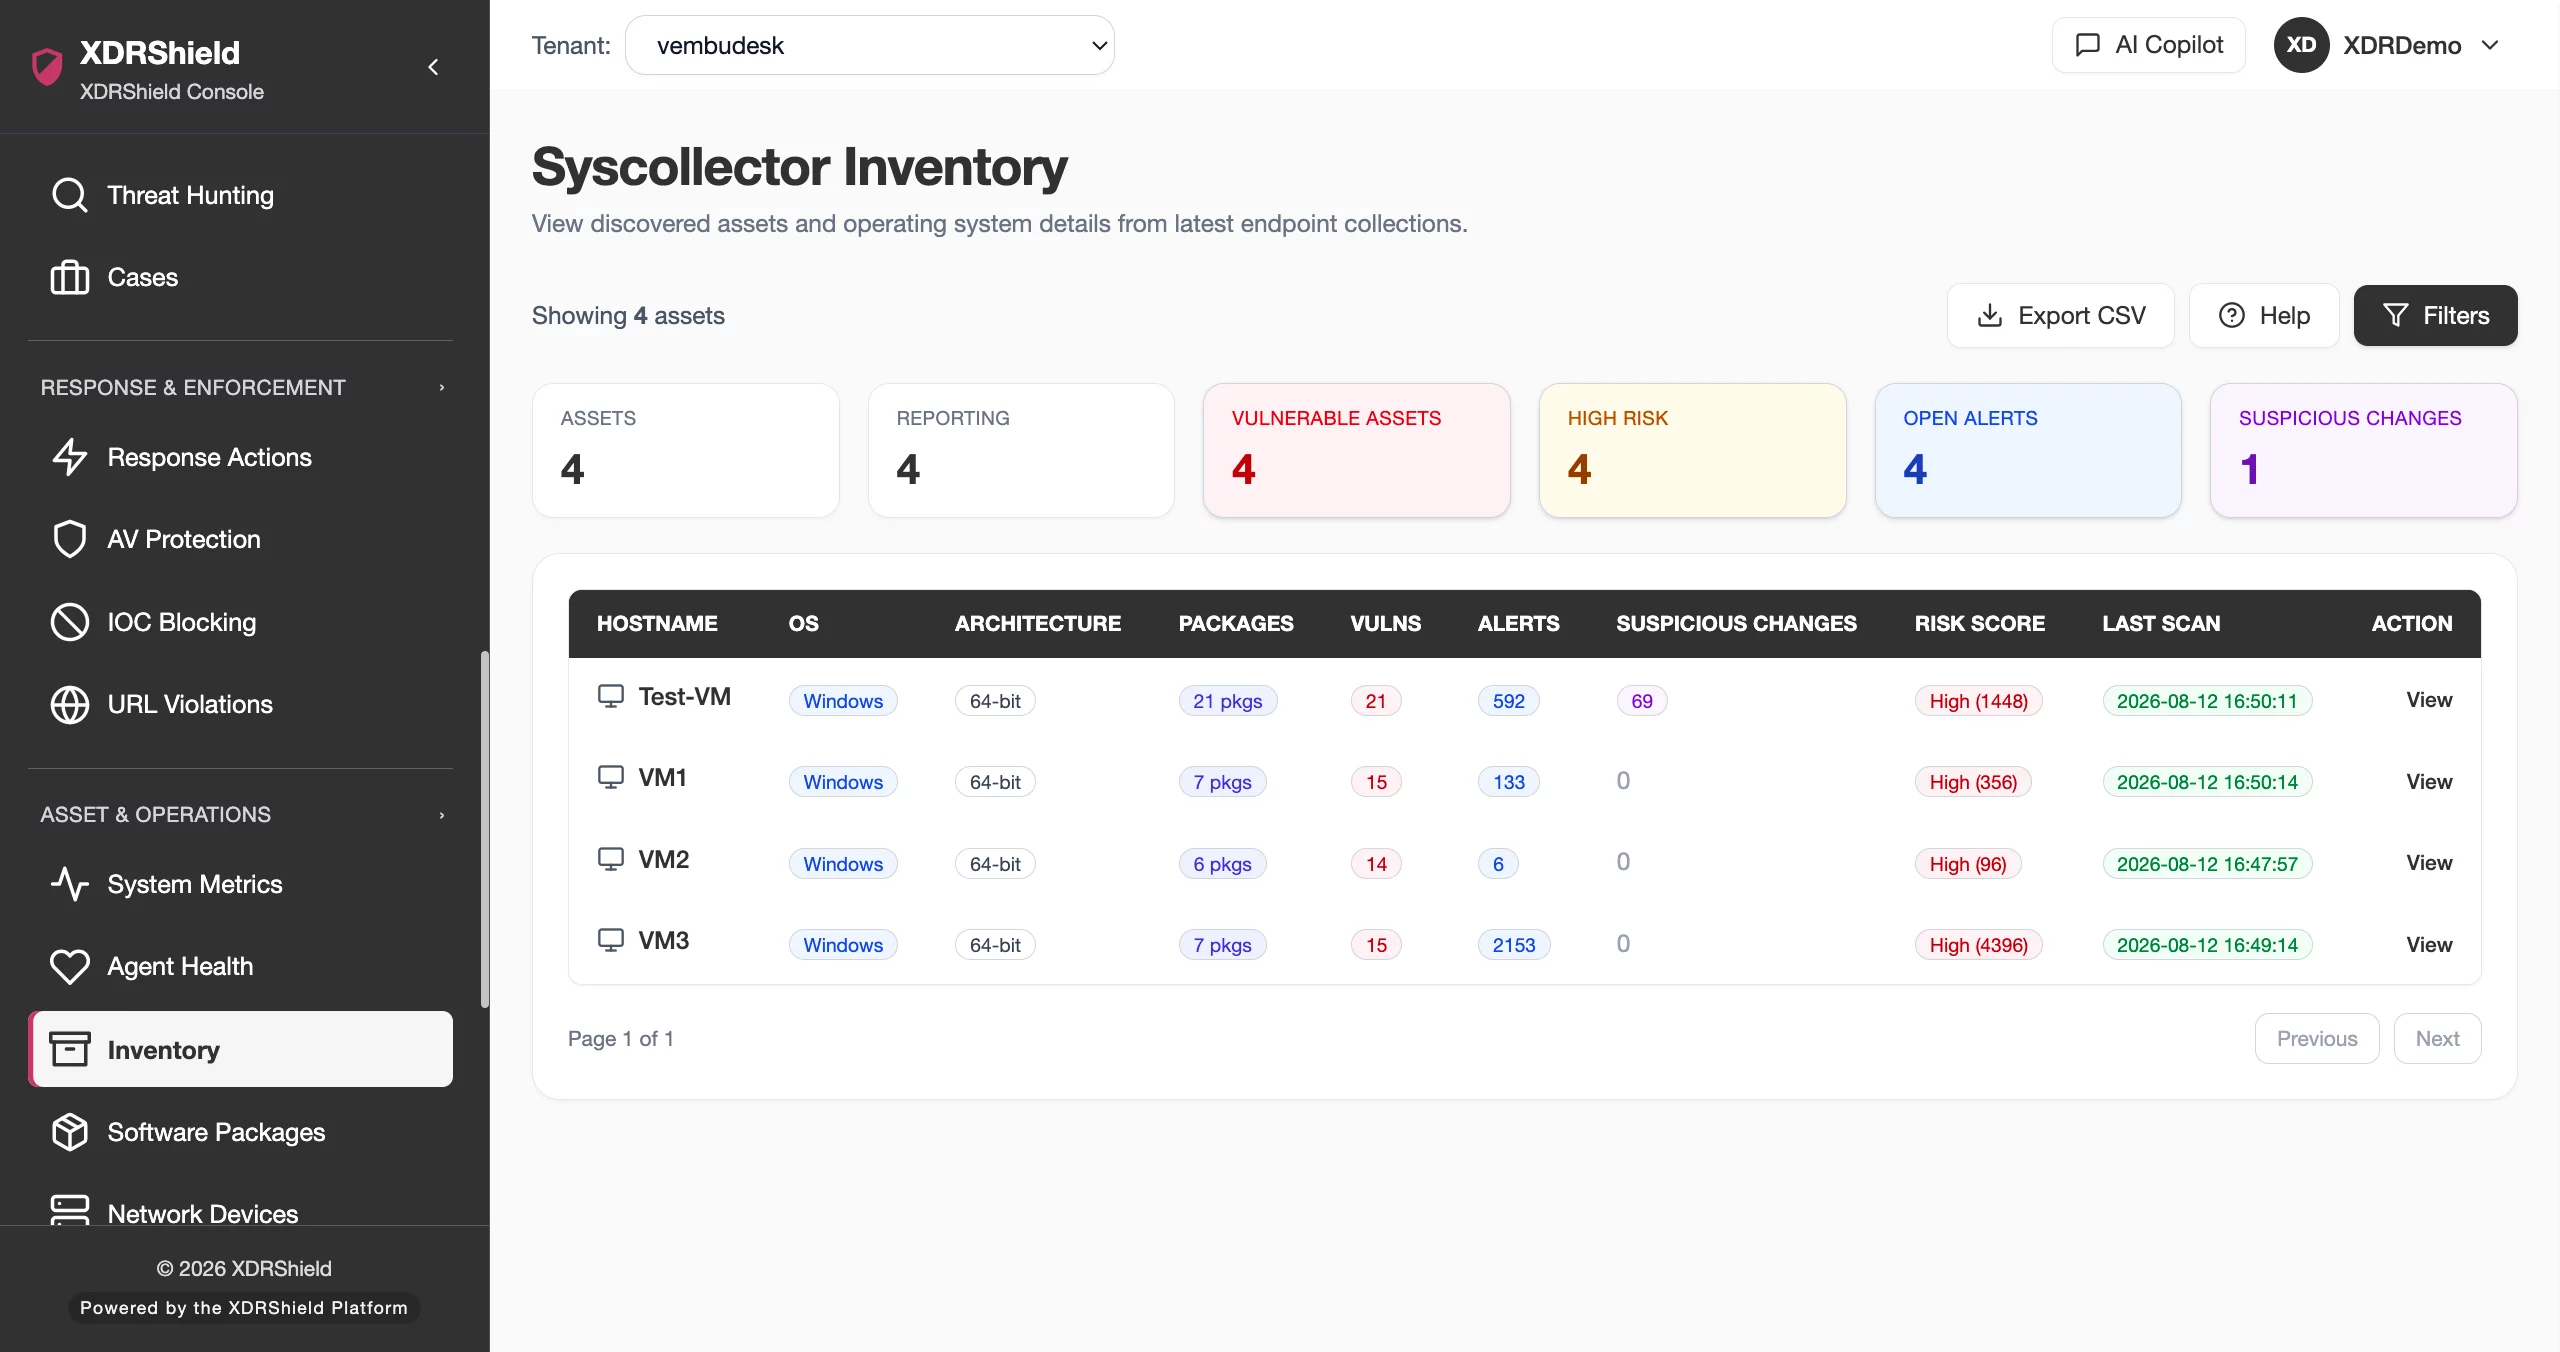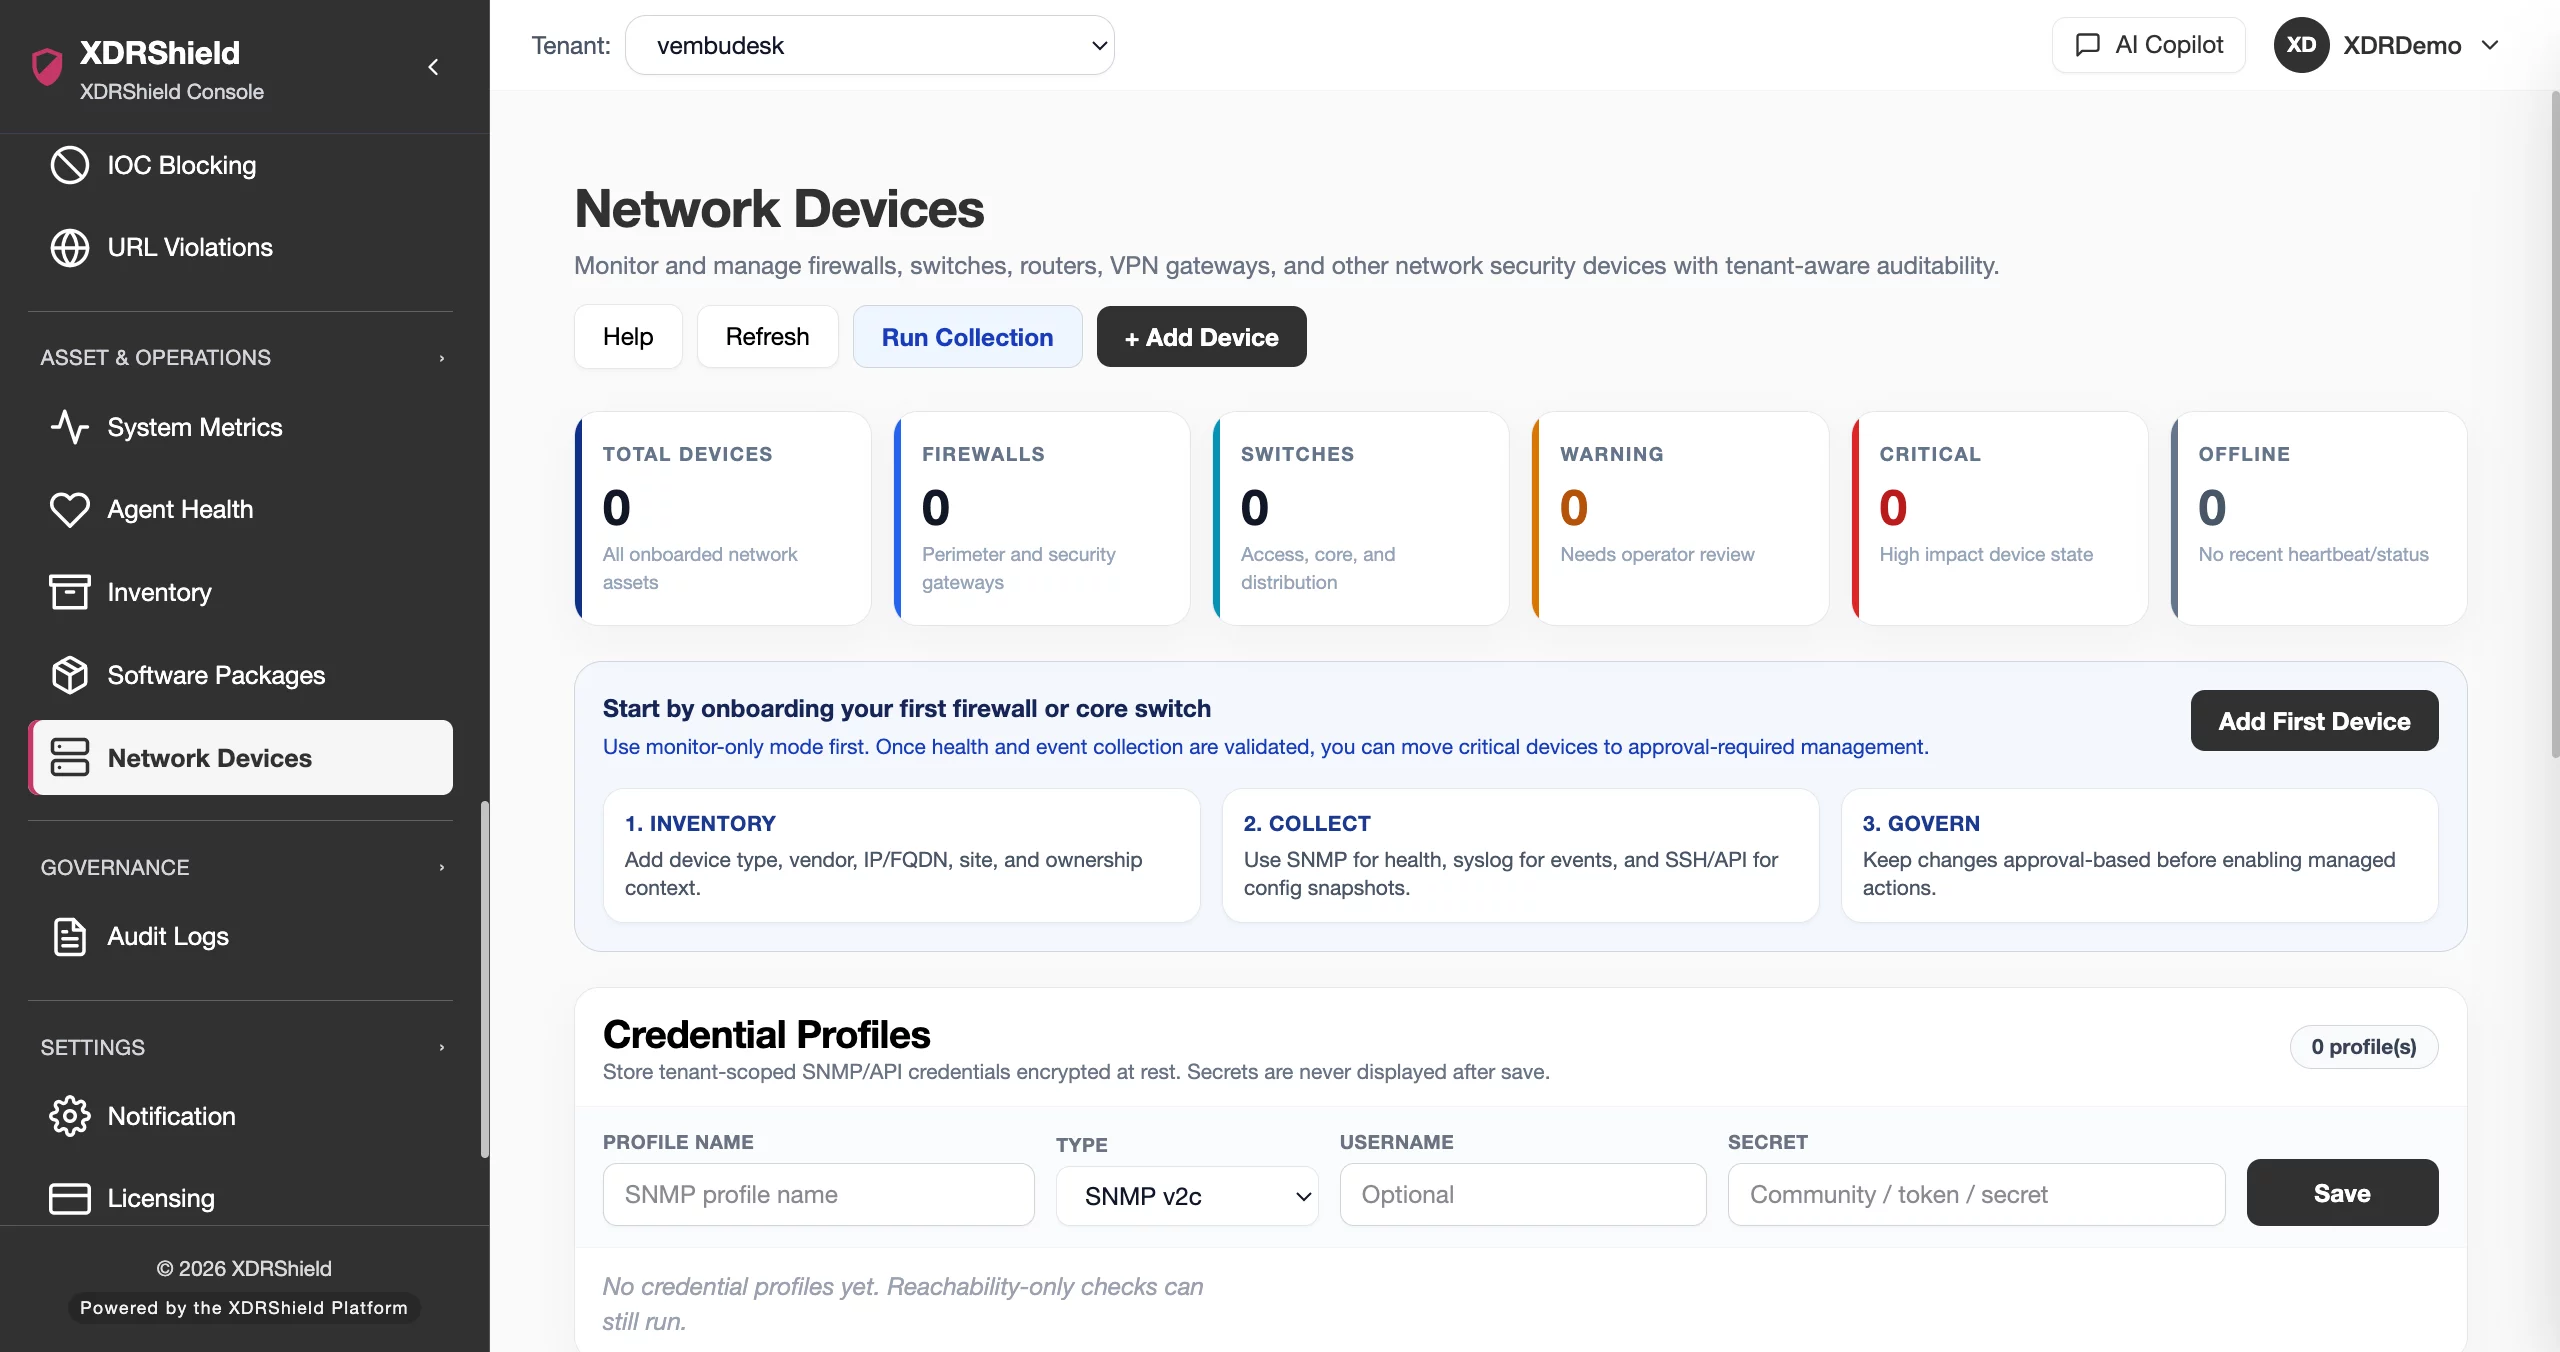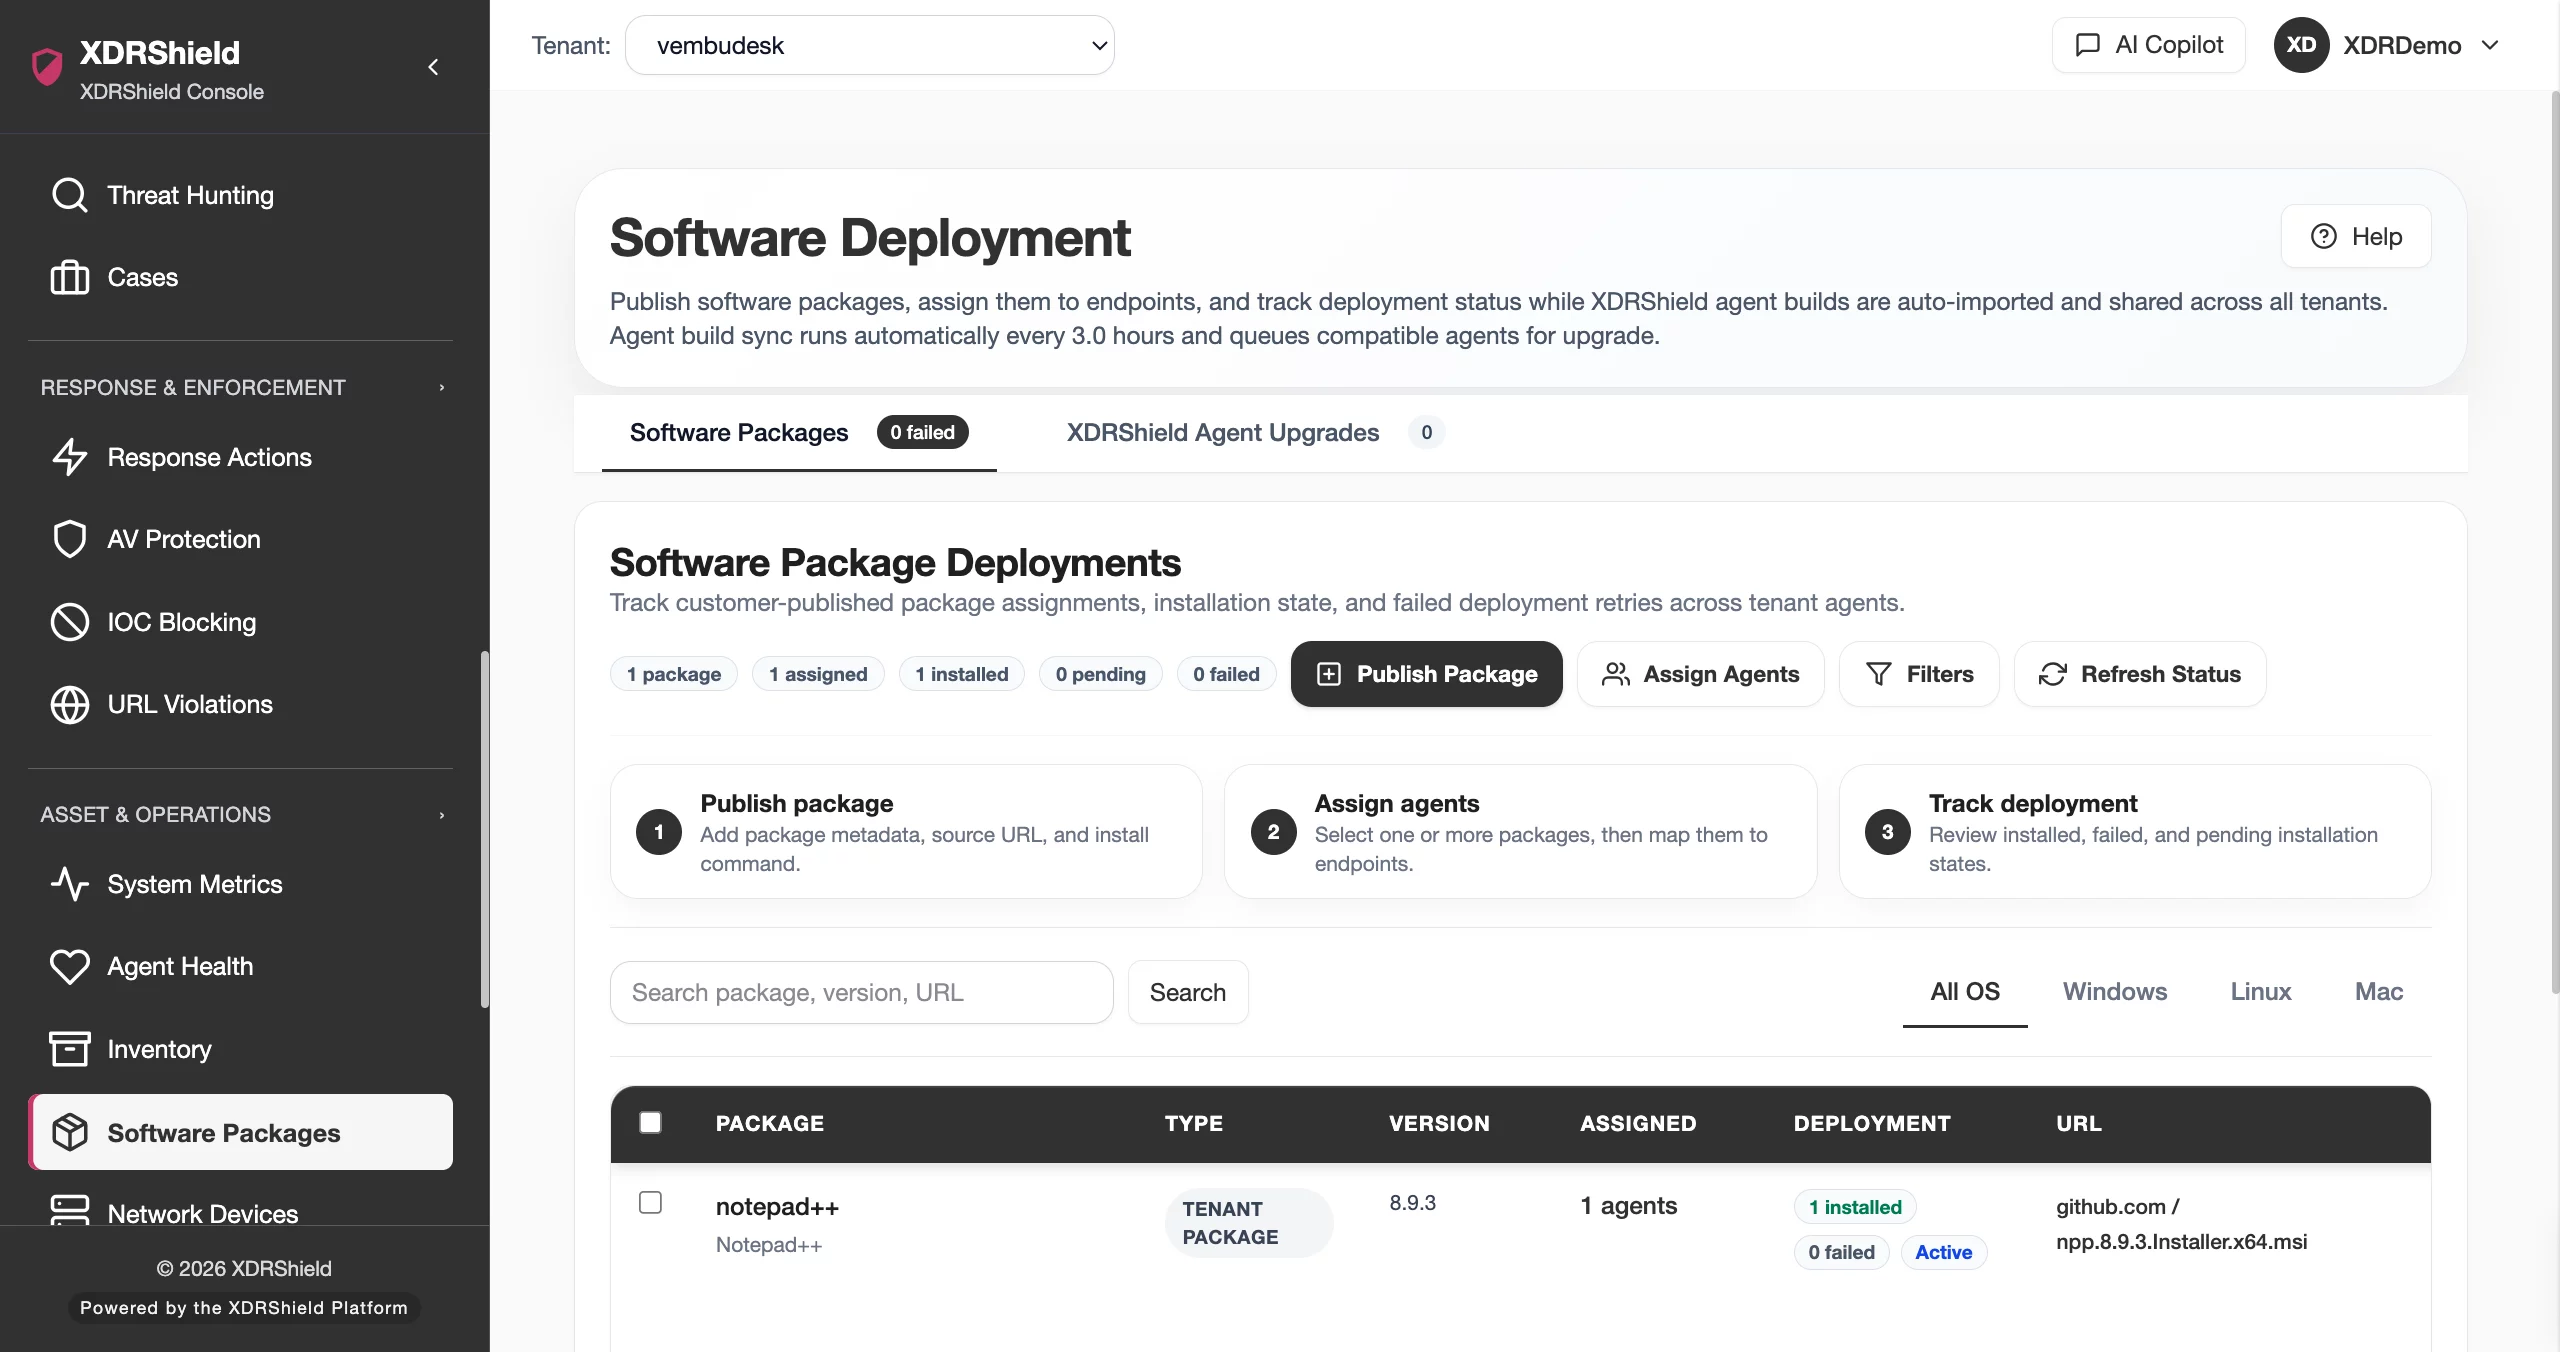
Track process activity and system metrics to detect anomalies before they become incidents.
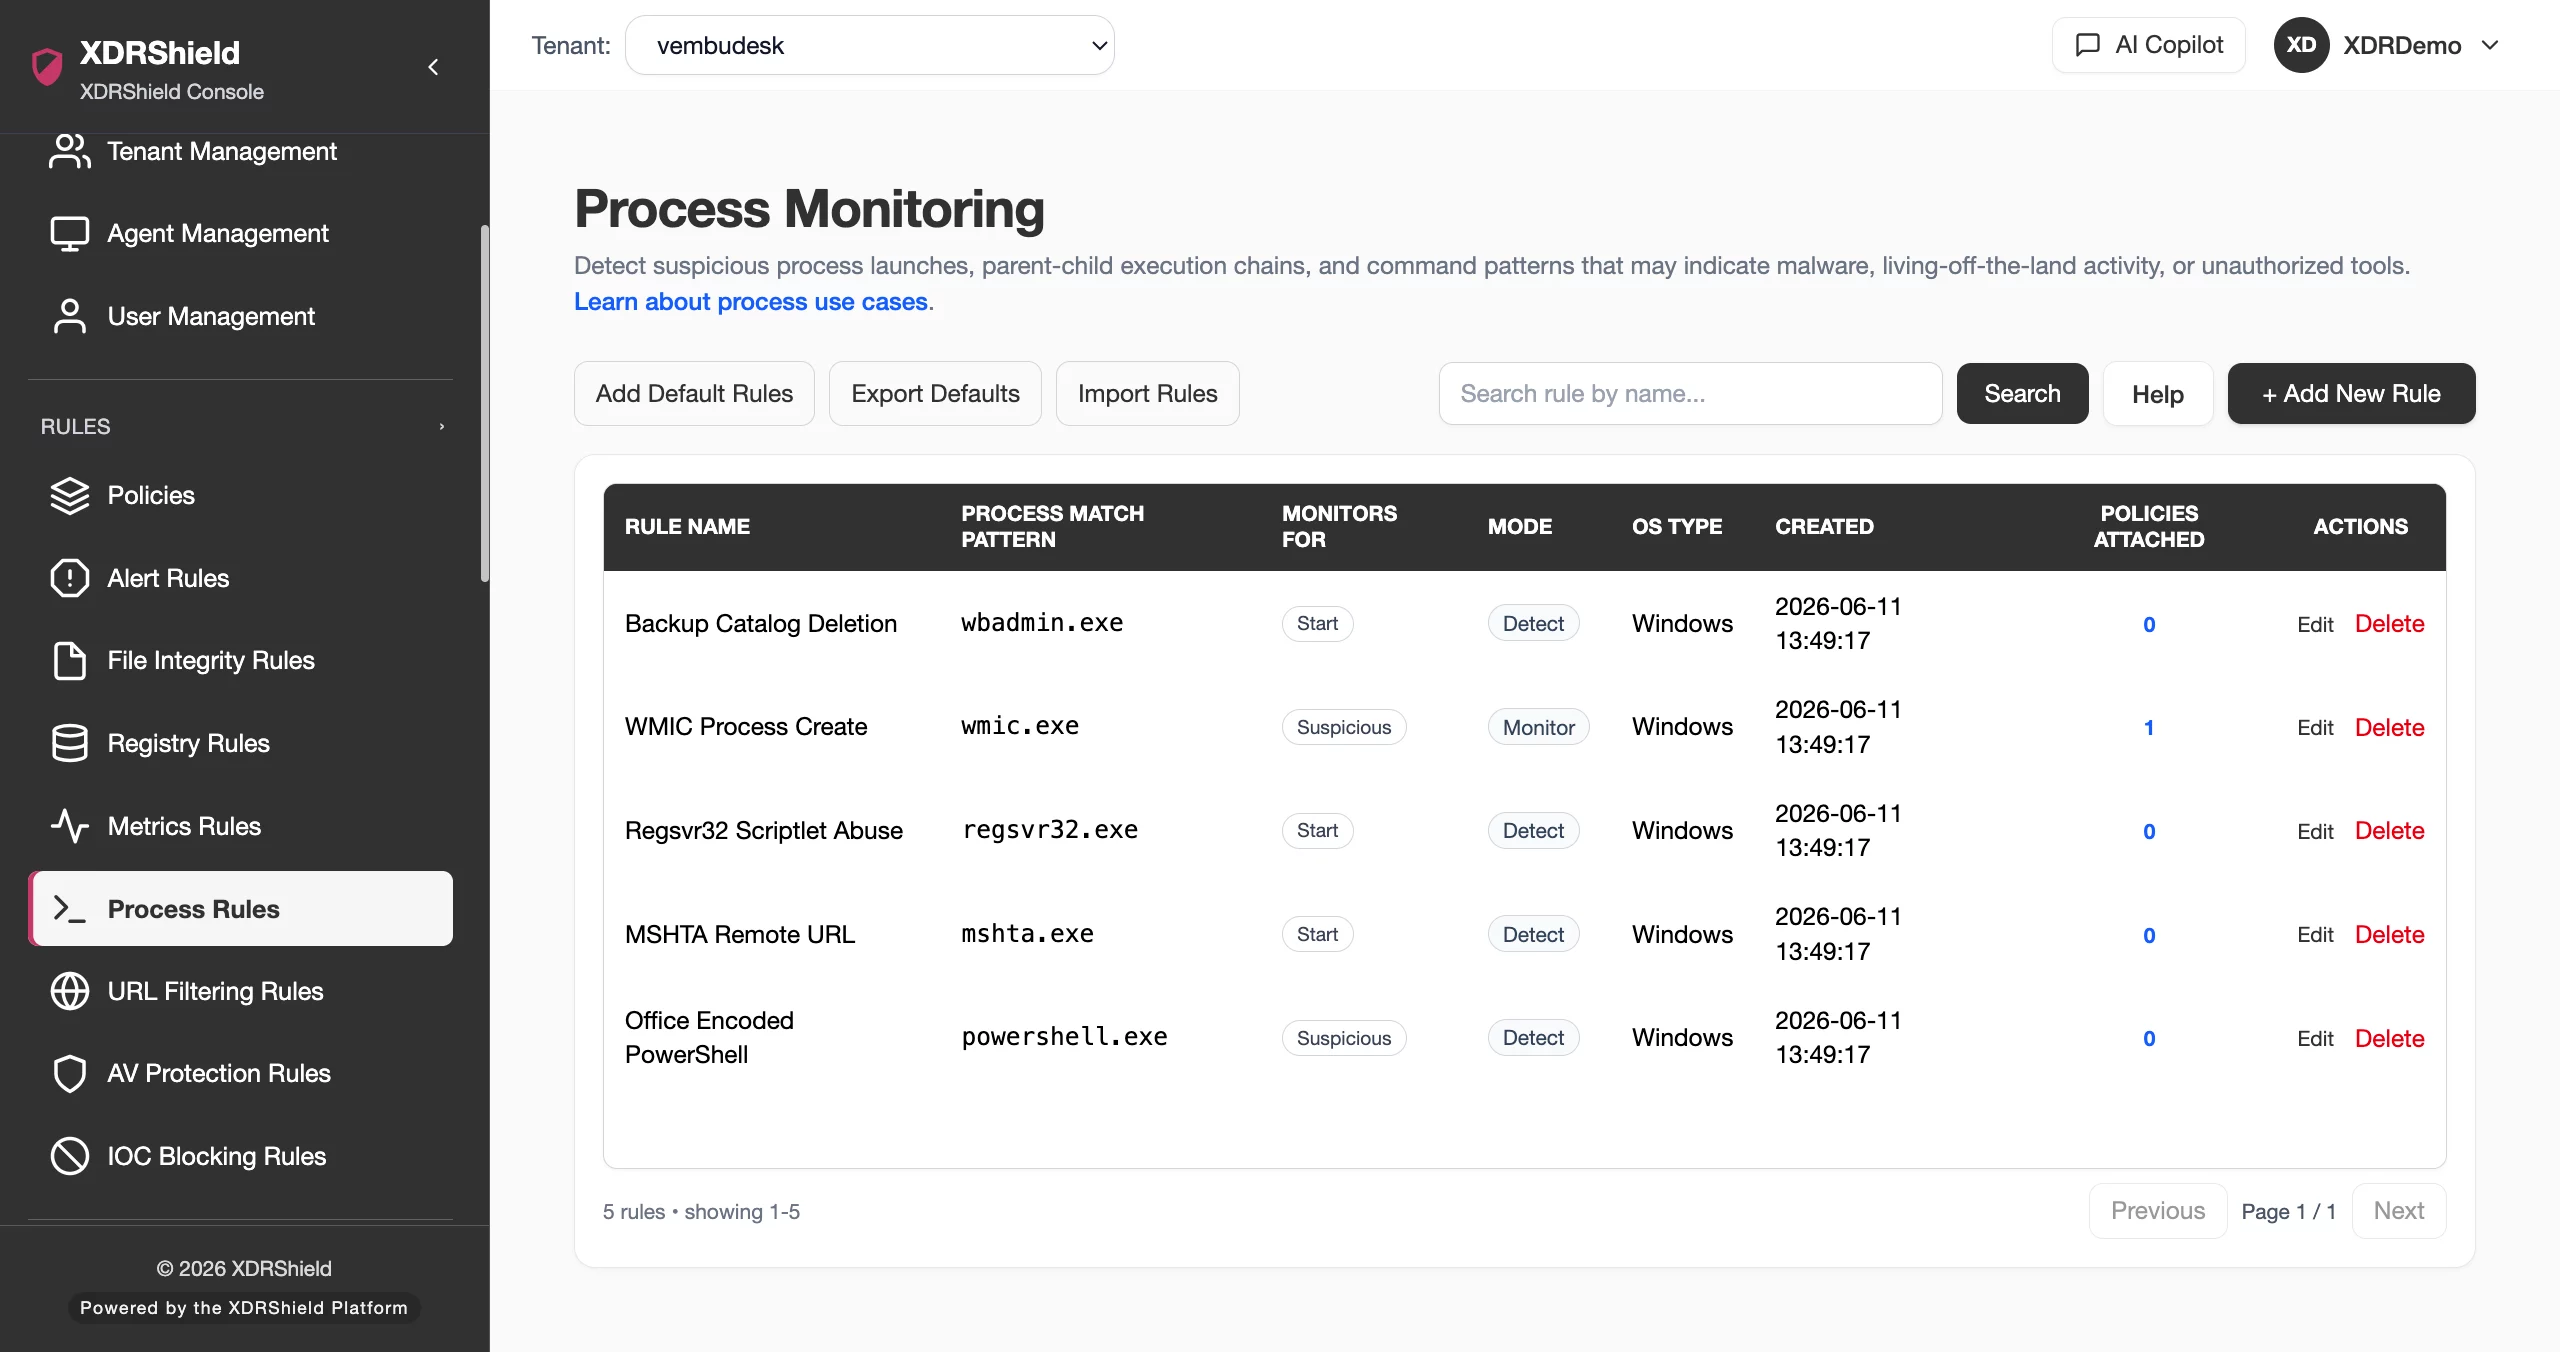
XDRShield Process and System Metrics Monitoring captures process creation, modification, and termination events with full command-line visibility, parent-child relationships, and user context, alongside CPU, memory, disk, and network utilization data so security and IT teams can detect suspicious behavior, investigate incidents, and connect process and metric evidence to alerts, cases, and response workflows.
Process behavior and resource patterns are often the first visible signal of compromise or operational risk.
Suspicious process activity, unusual parent-child relationships, and anomalous resource usage can indicate malware, persistence, crypto-mining, or resource exhaustion. Process and system metrics monitoring makes that activity visible, reviewable, and connectable to investigation and response workflows.
Collect process events and system metrics, scope through policies, and review with full endpoint context.
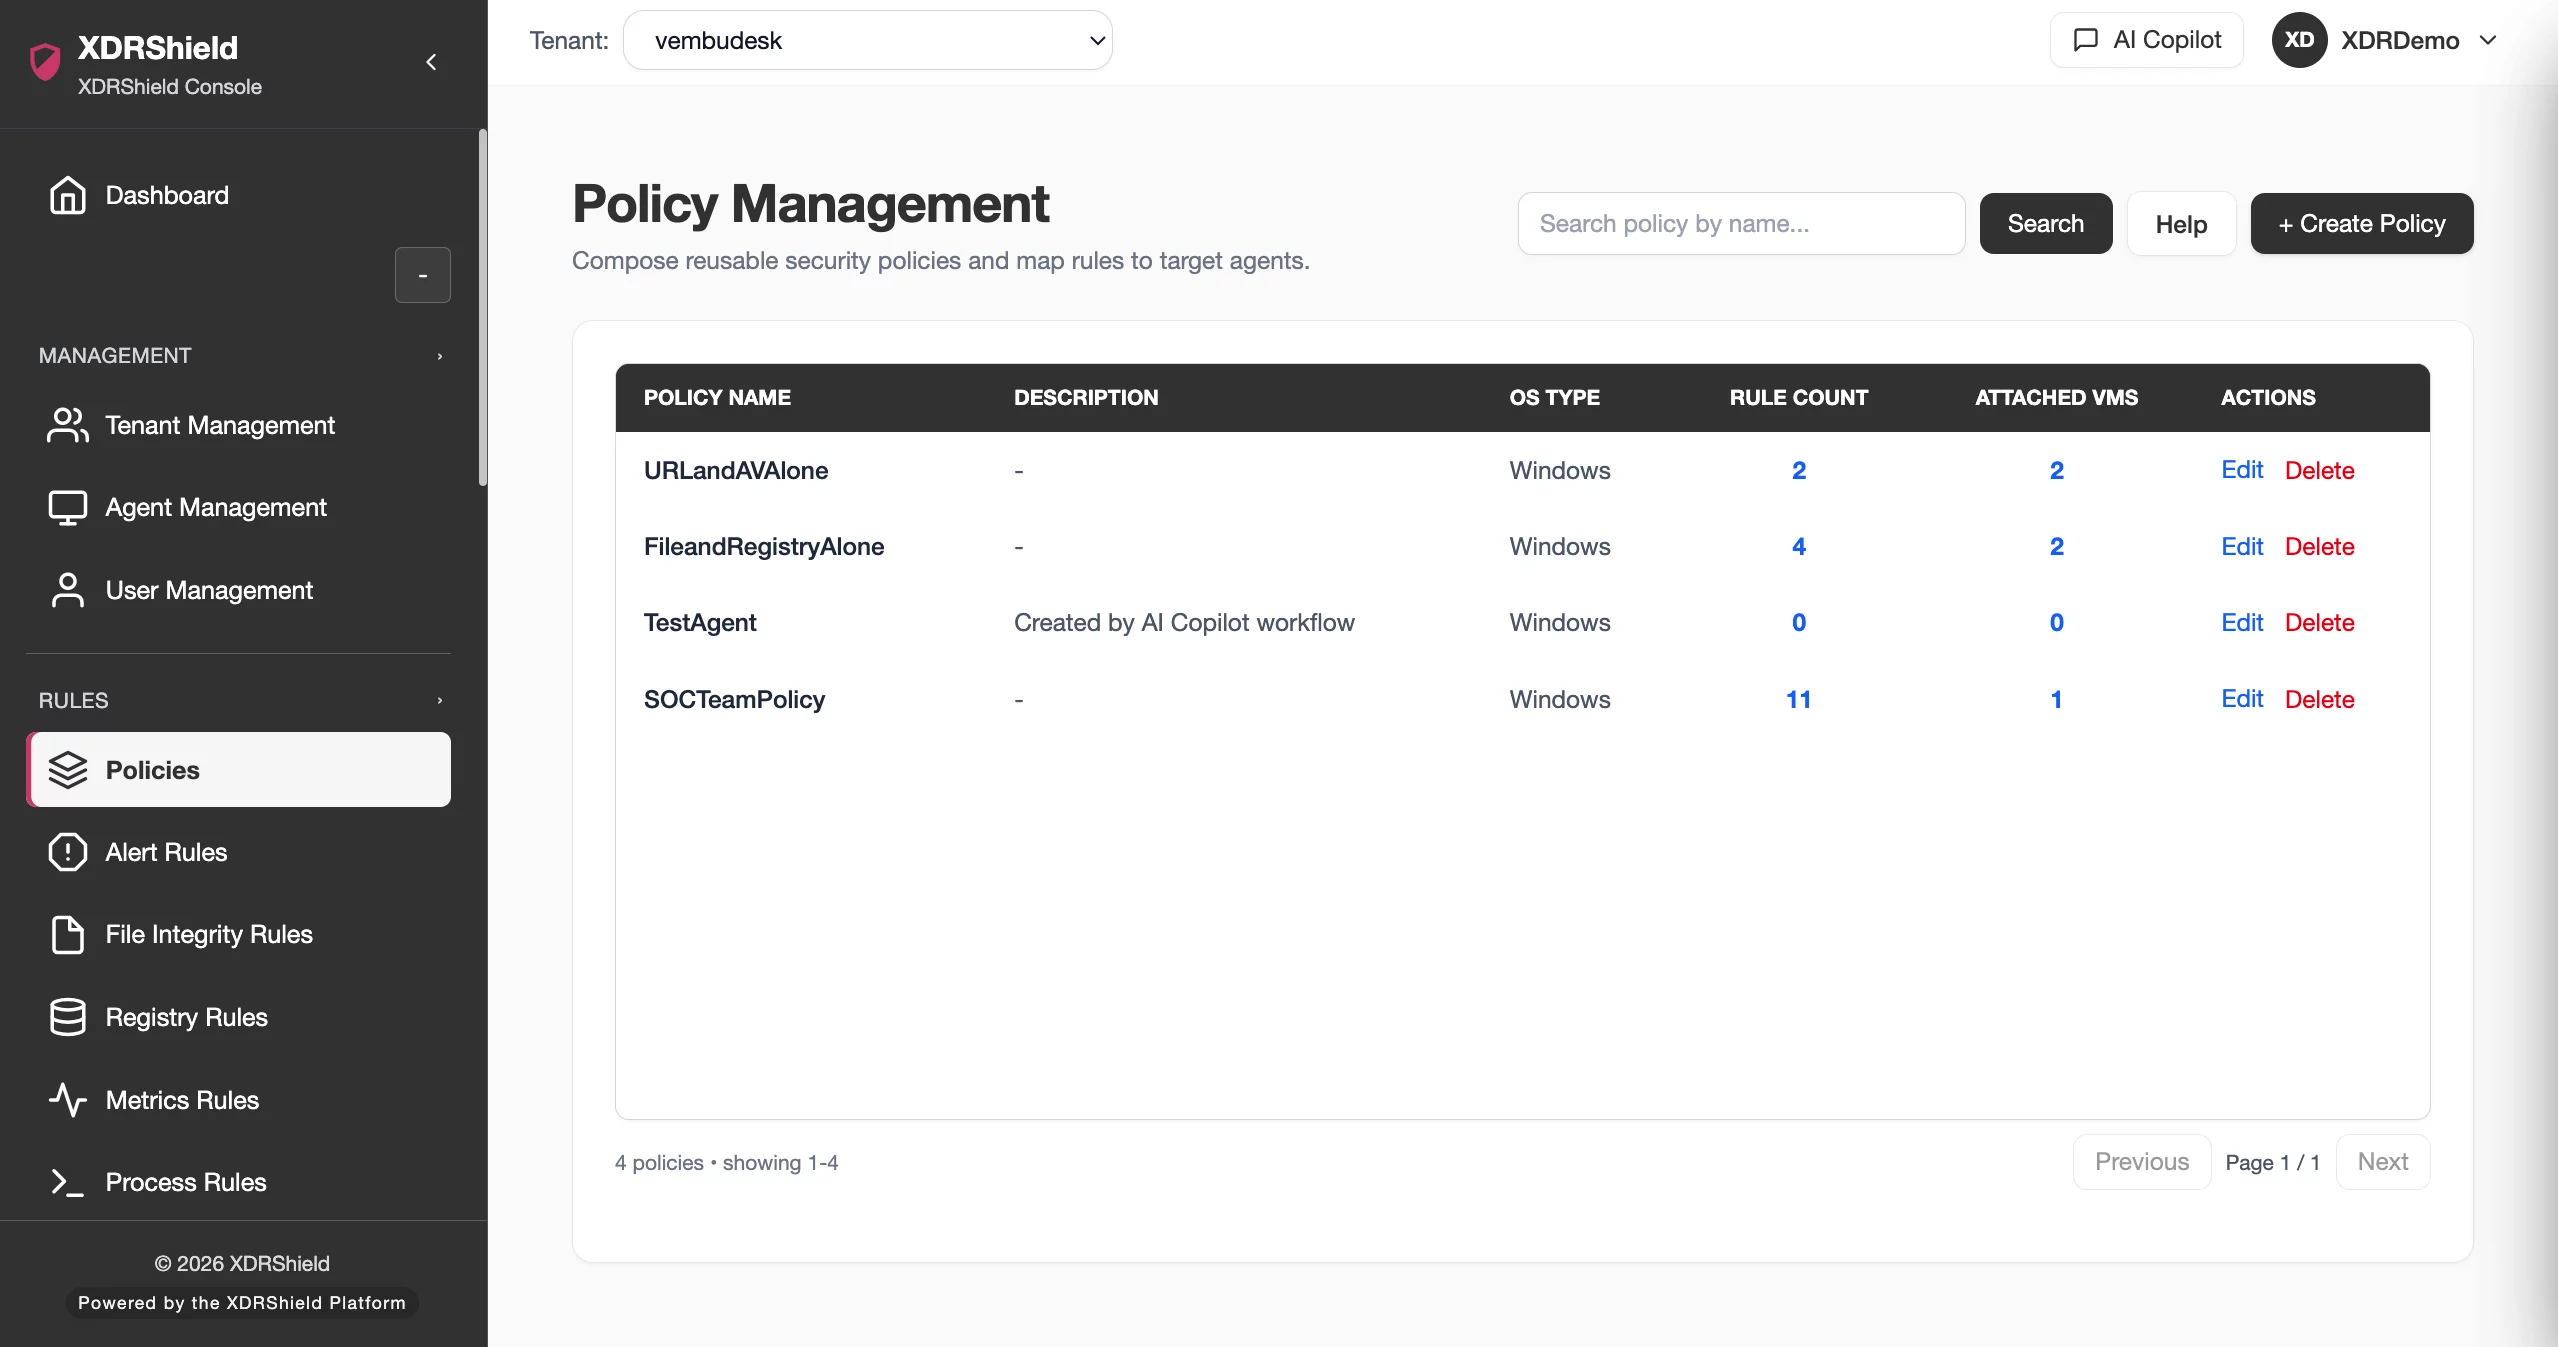
Process monitoring and system metrics collection are policy-scoped capabilities. Endpoint agents capture process creation, modification, and termination events with command-line arguments, user context, PID, PPID, image path, and hash data. Agents also collect CPU, memory, disk I/O, and network I/O metrics per endpoint. Threshold-based metric rules detect anomalous resource patterns, and all data is available for alert correlation, case investigation, and timeline reconstruction.
- Collect process events with command-line arguments, parent-child relationships, and process metadata.
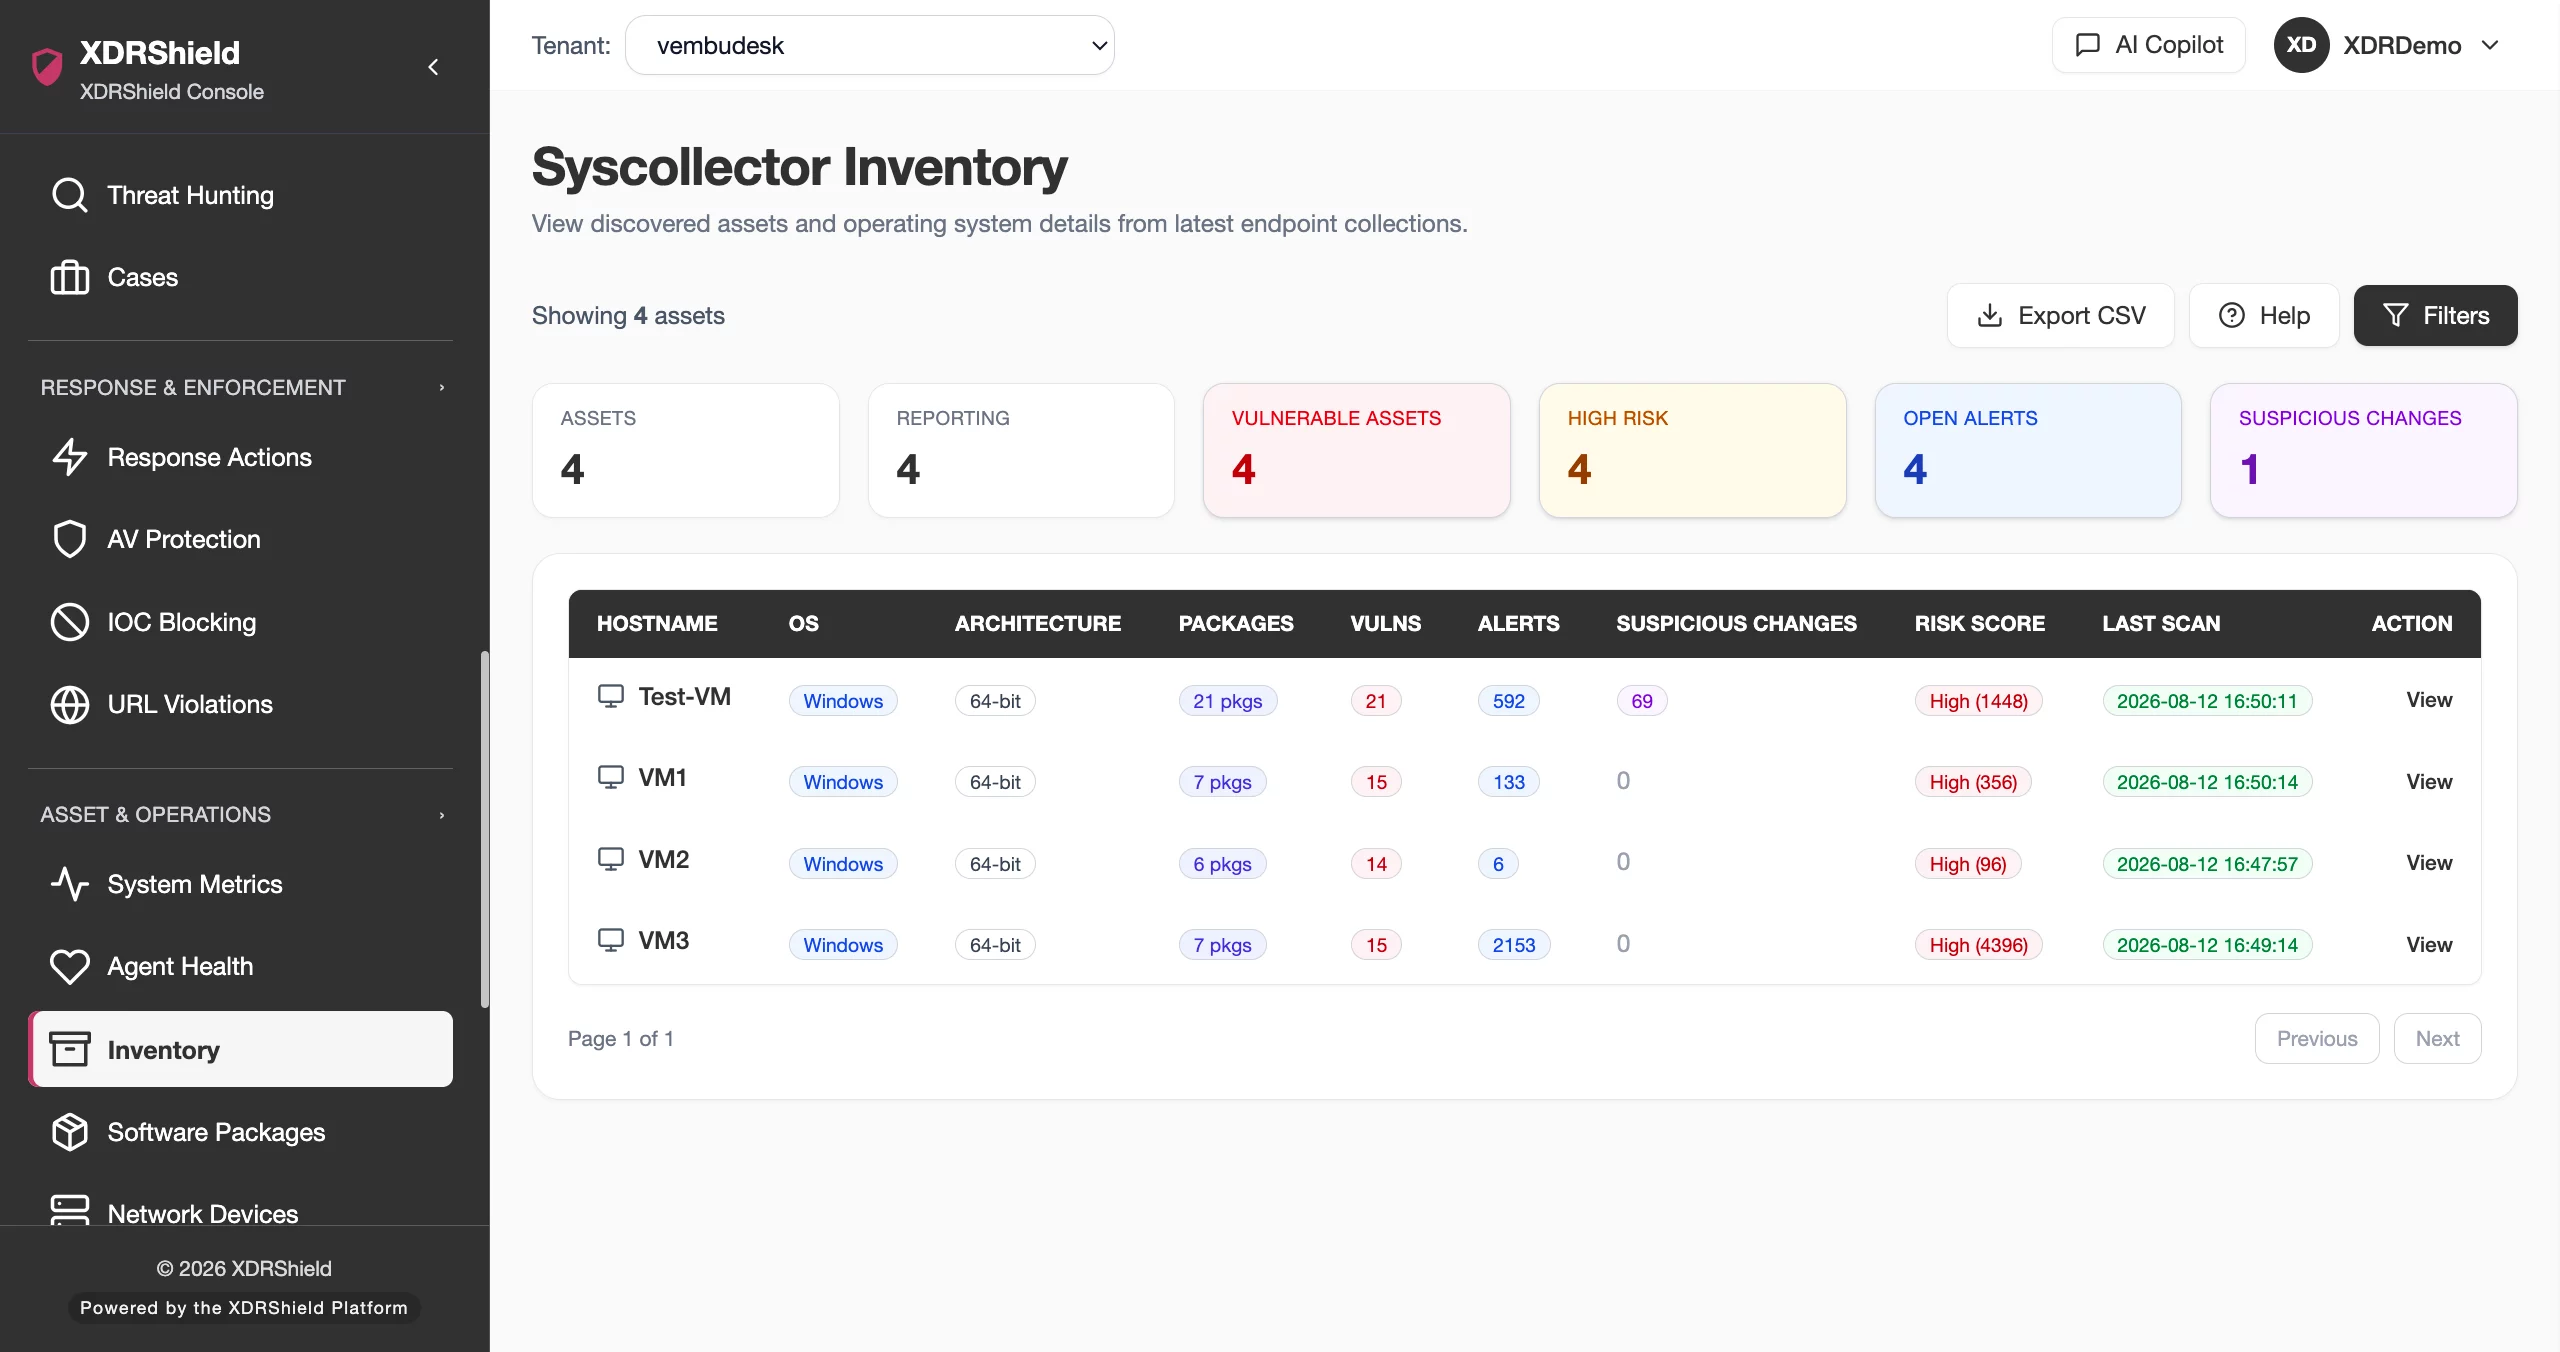
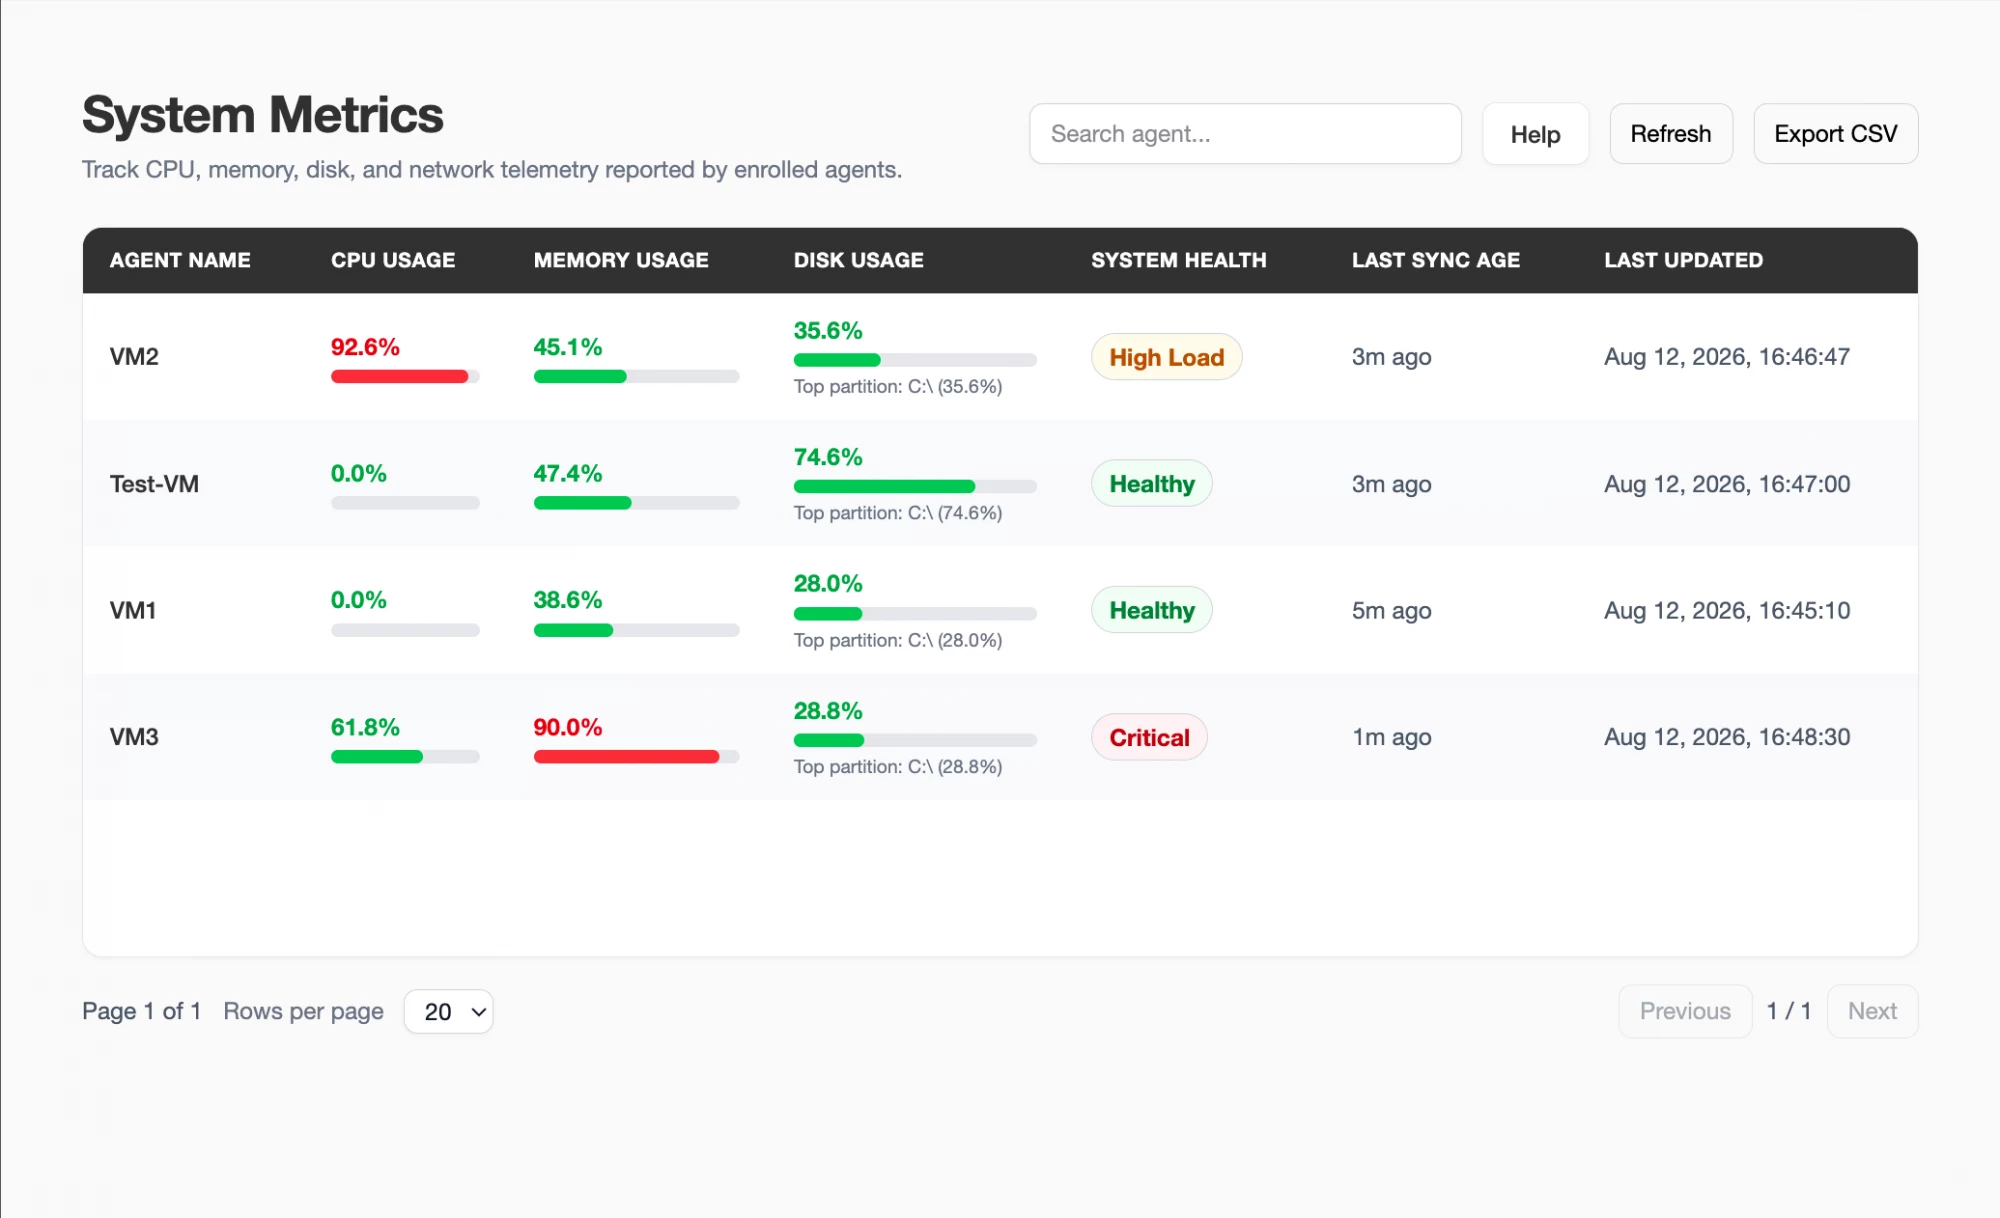
- Gather CPU, memory, disk, and network metrics per endpoint for operational health and anomaly detection.
- Apply threshold-based metric rules to detect anomalous resource usage patterns.
- Correlate process and metric data with alerts, cases, and investigation workflows.
What XDRShield Process and System Metrics Monitoring helps teams do.
Each capability supports a part of the monitoring workflow, from process tracking and metric collection to anomaly detection, investigation linkage, and compliance evidence.
Process creation, modification, and termination tracking
Capture process events with full command-line arguments, user context, PID, PPID, image path, and hash data across monitored endpoints.
Parent-child process relationship mapping
Visualize parent-child process chains to detect unusual process trees, injection patterns, and suspicious execution paths.
System resource metrics collection
Collect CPU usage, memory utilization, disk I/O, and network I/O per endpoint for operational health and performance troubleshooting.
Threshold-based metric rules
Define threshold rules to detect anomalous resource patterns that may indicate crypto-mining, resource exhaustion, or malware activity.
Historical process and metric data
Preserve historical process events and metric data for timeline reconstruction, trend analysis, and incident investigation.
Alert and event correlation
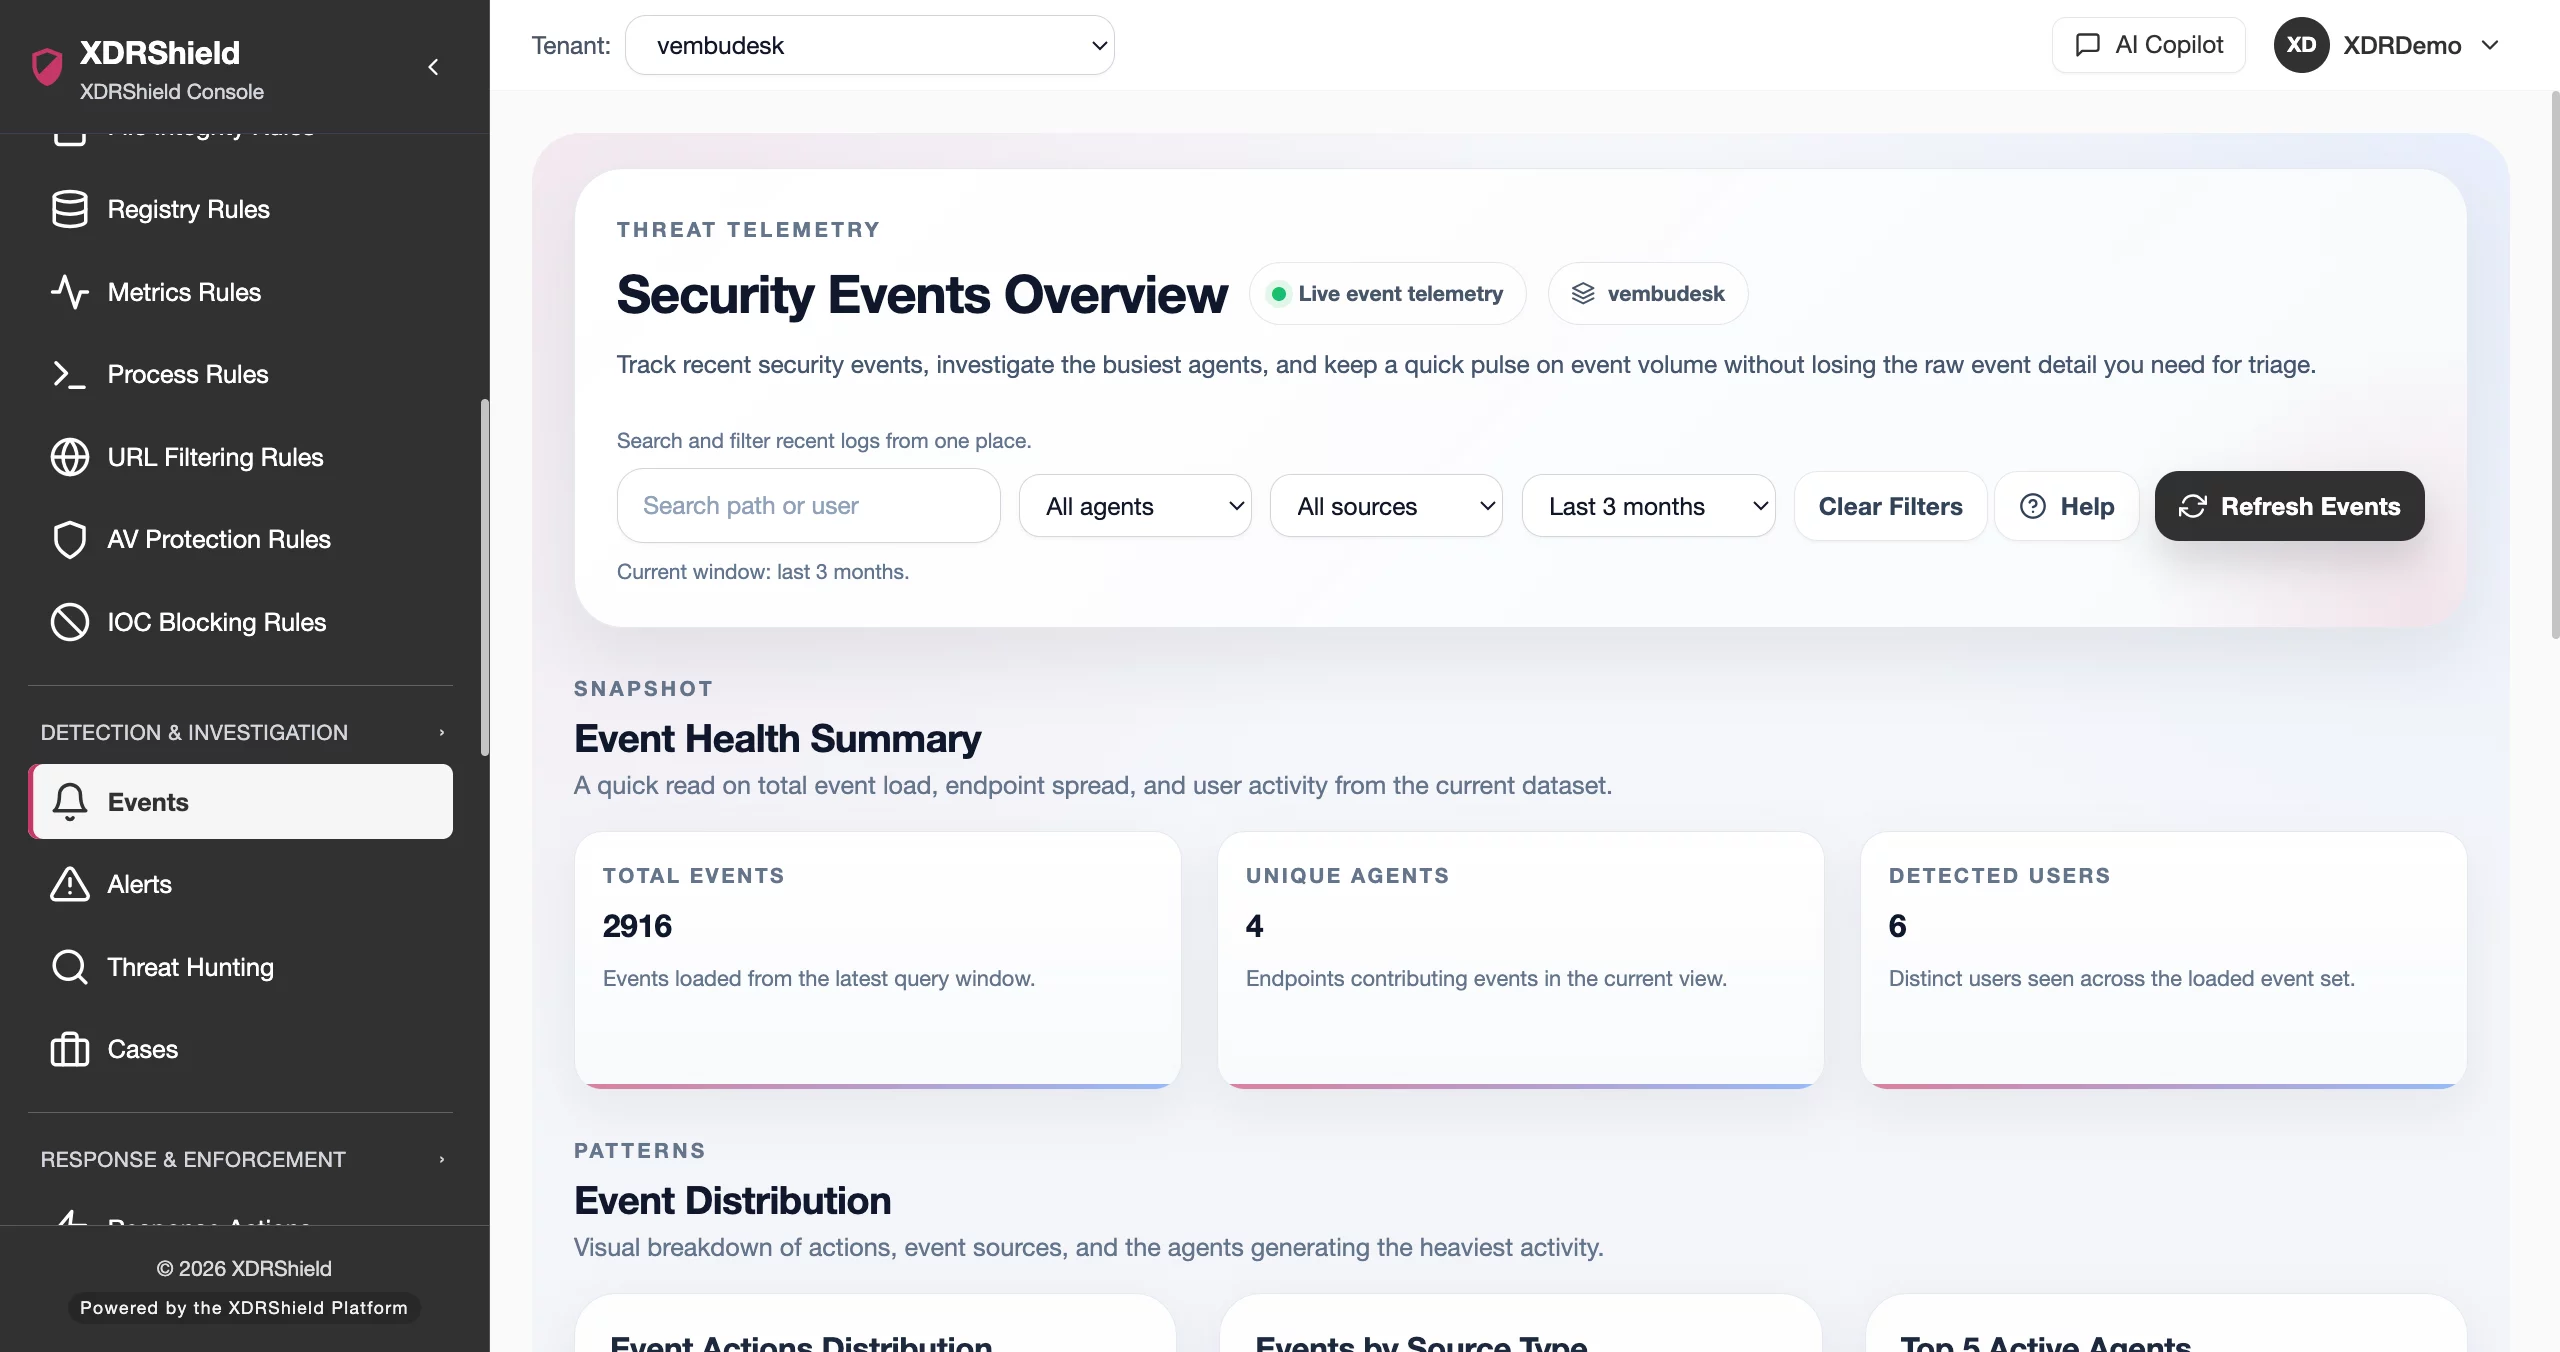
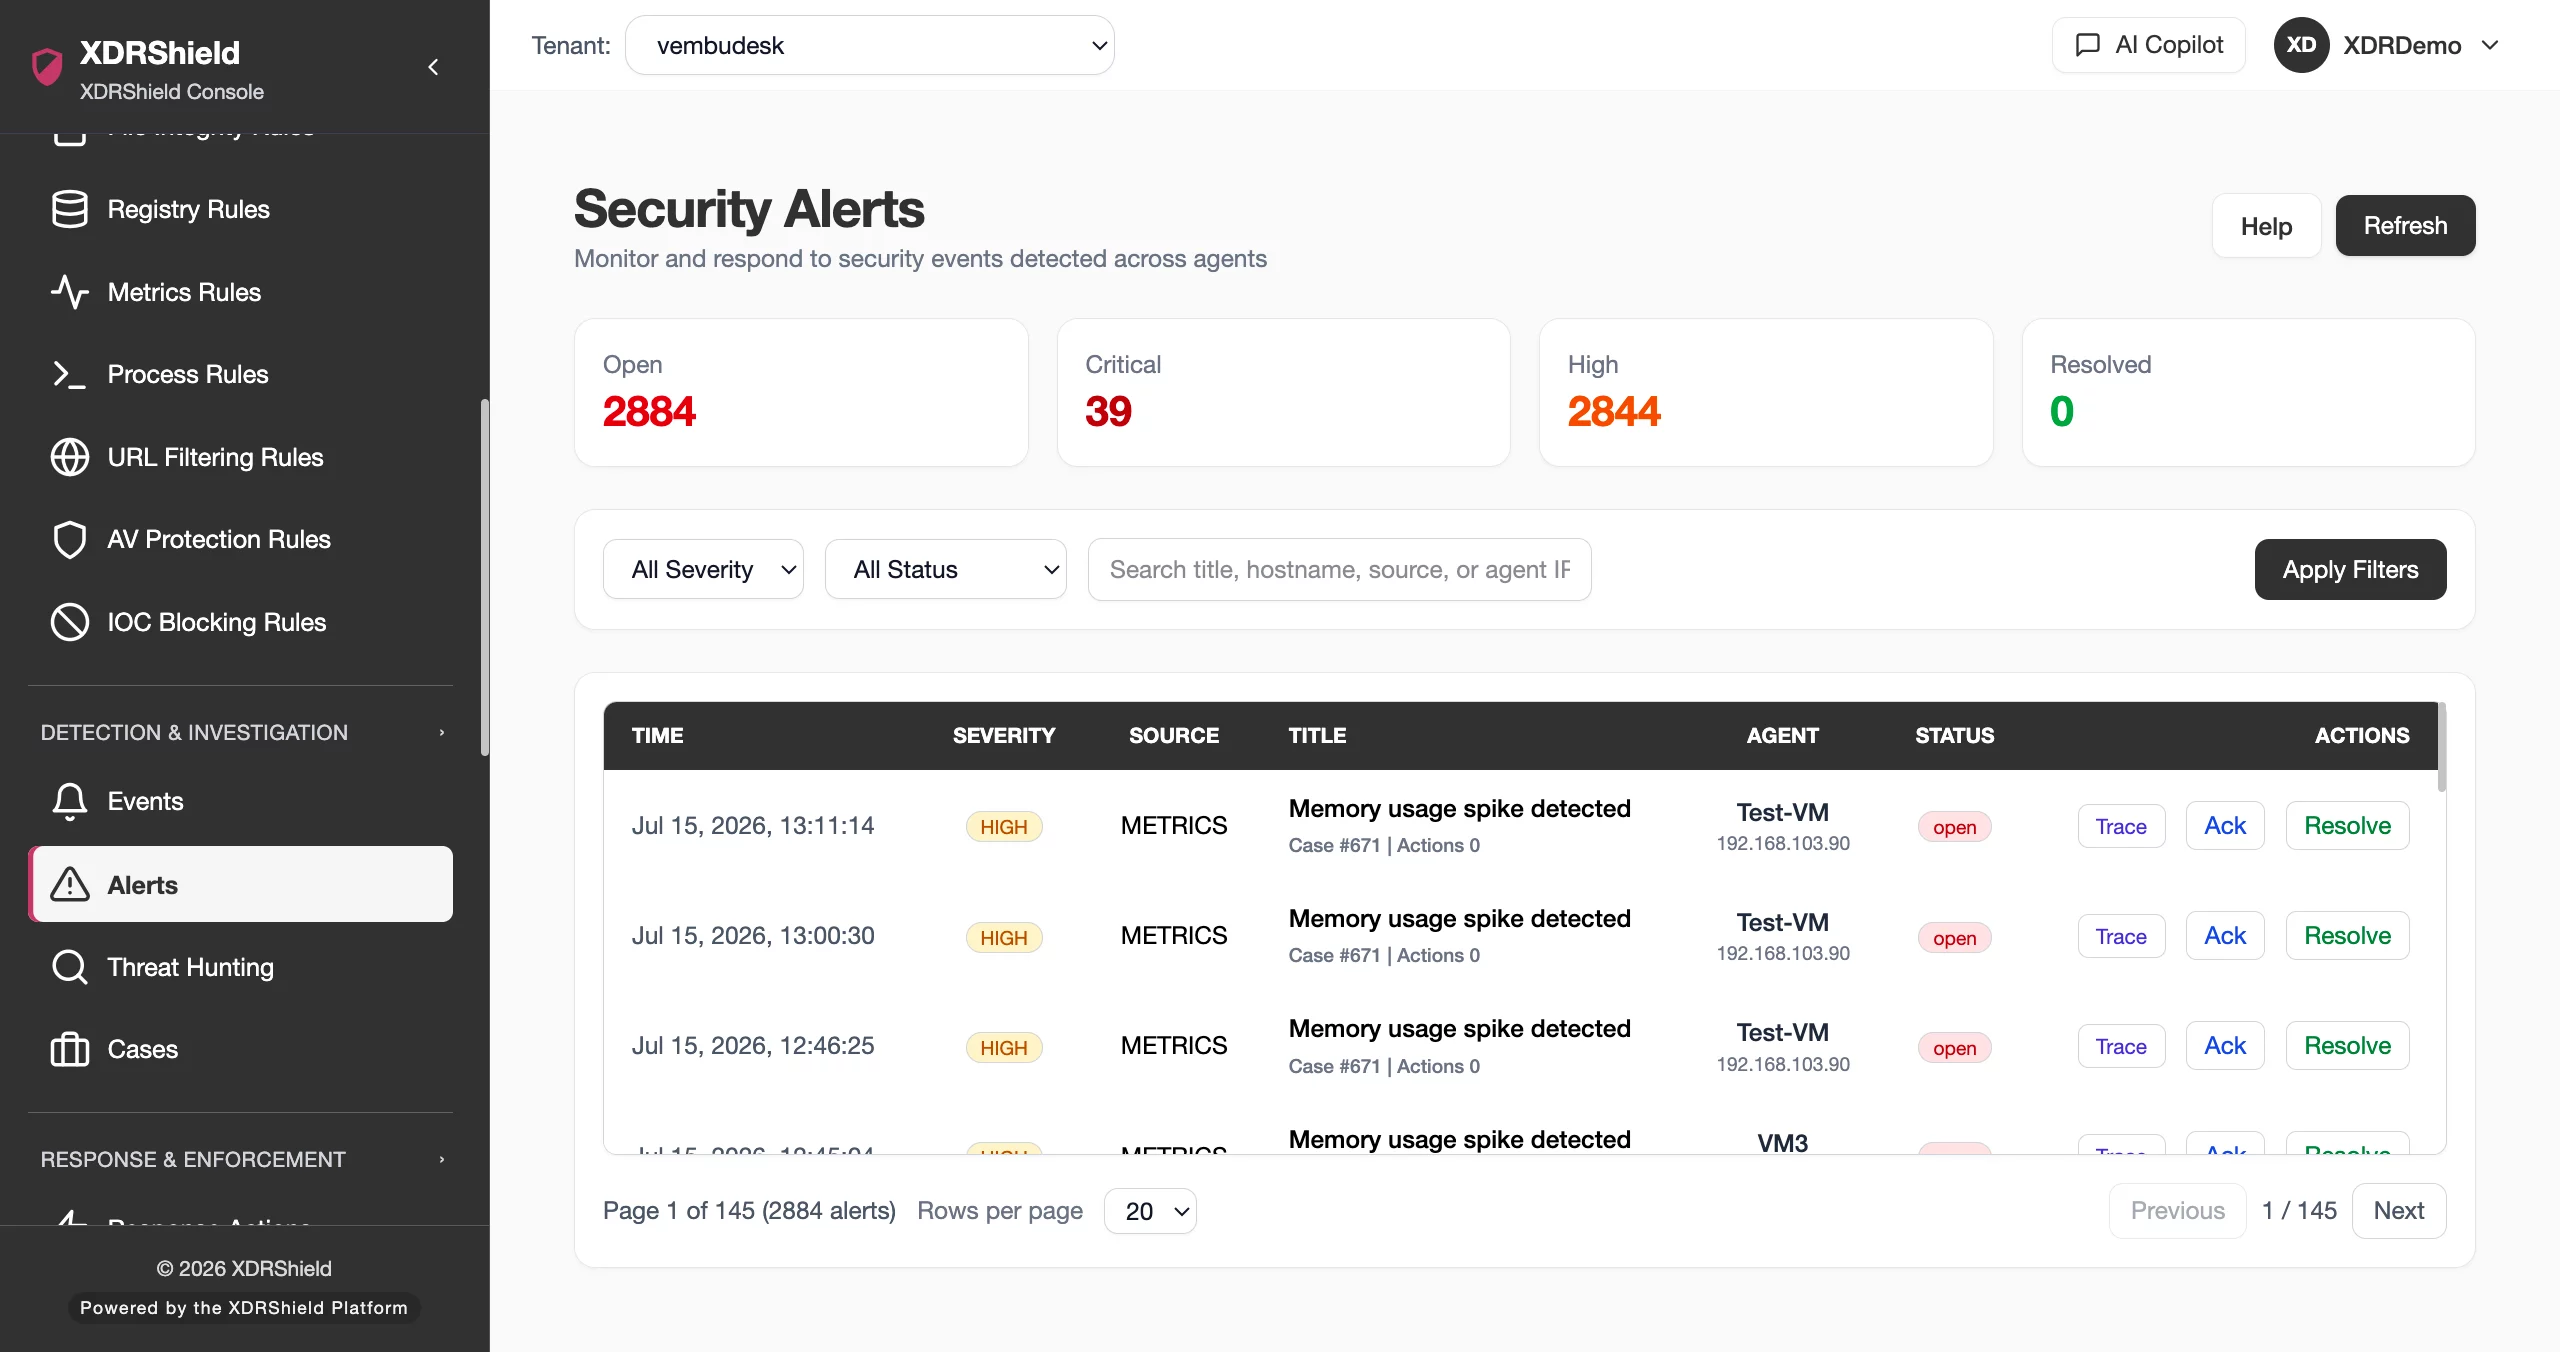
Connect process events and metric anomalies to security alerts, event triage, and case workflows so suspicious activity is not reviewed in isolation.
Investigation and case linkage
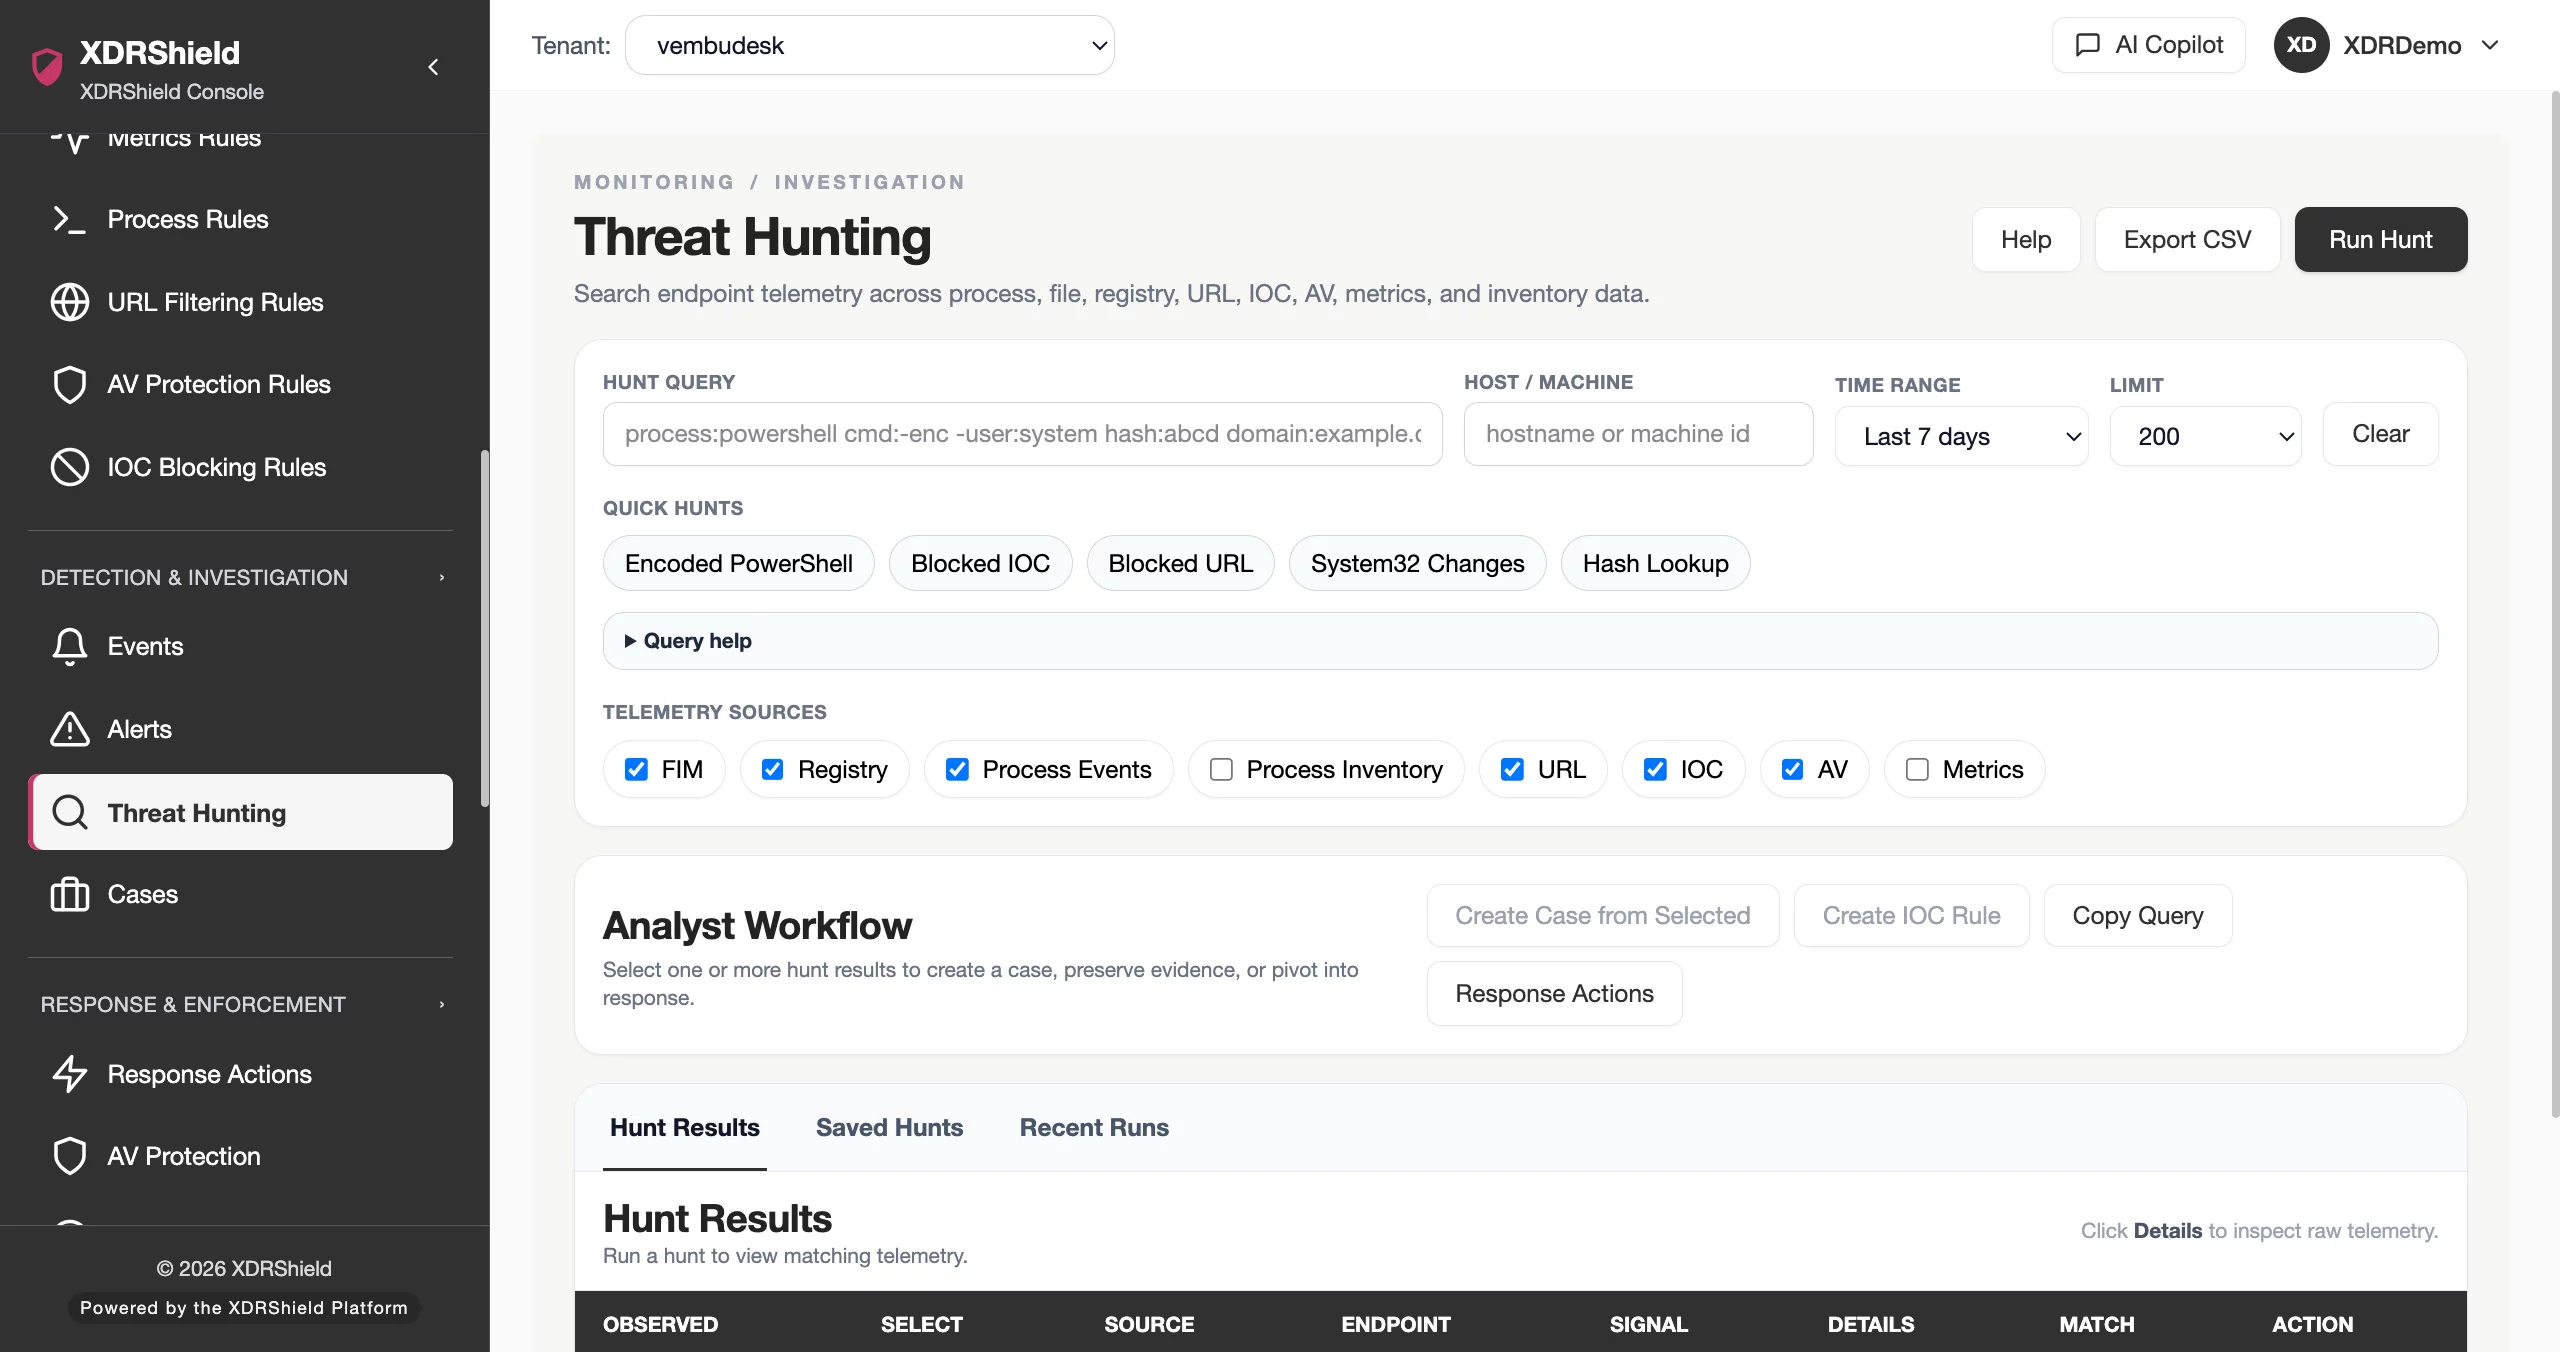
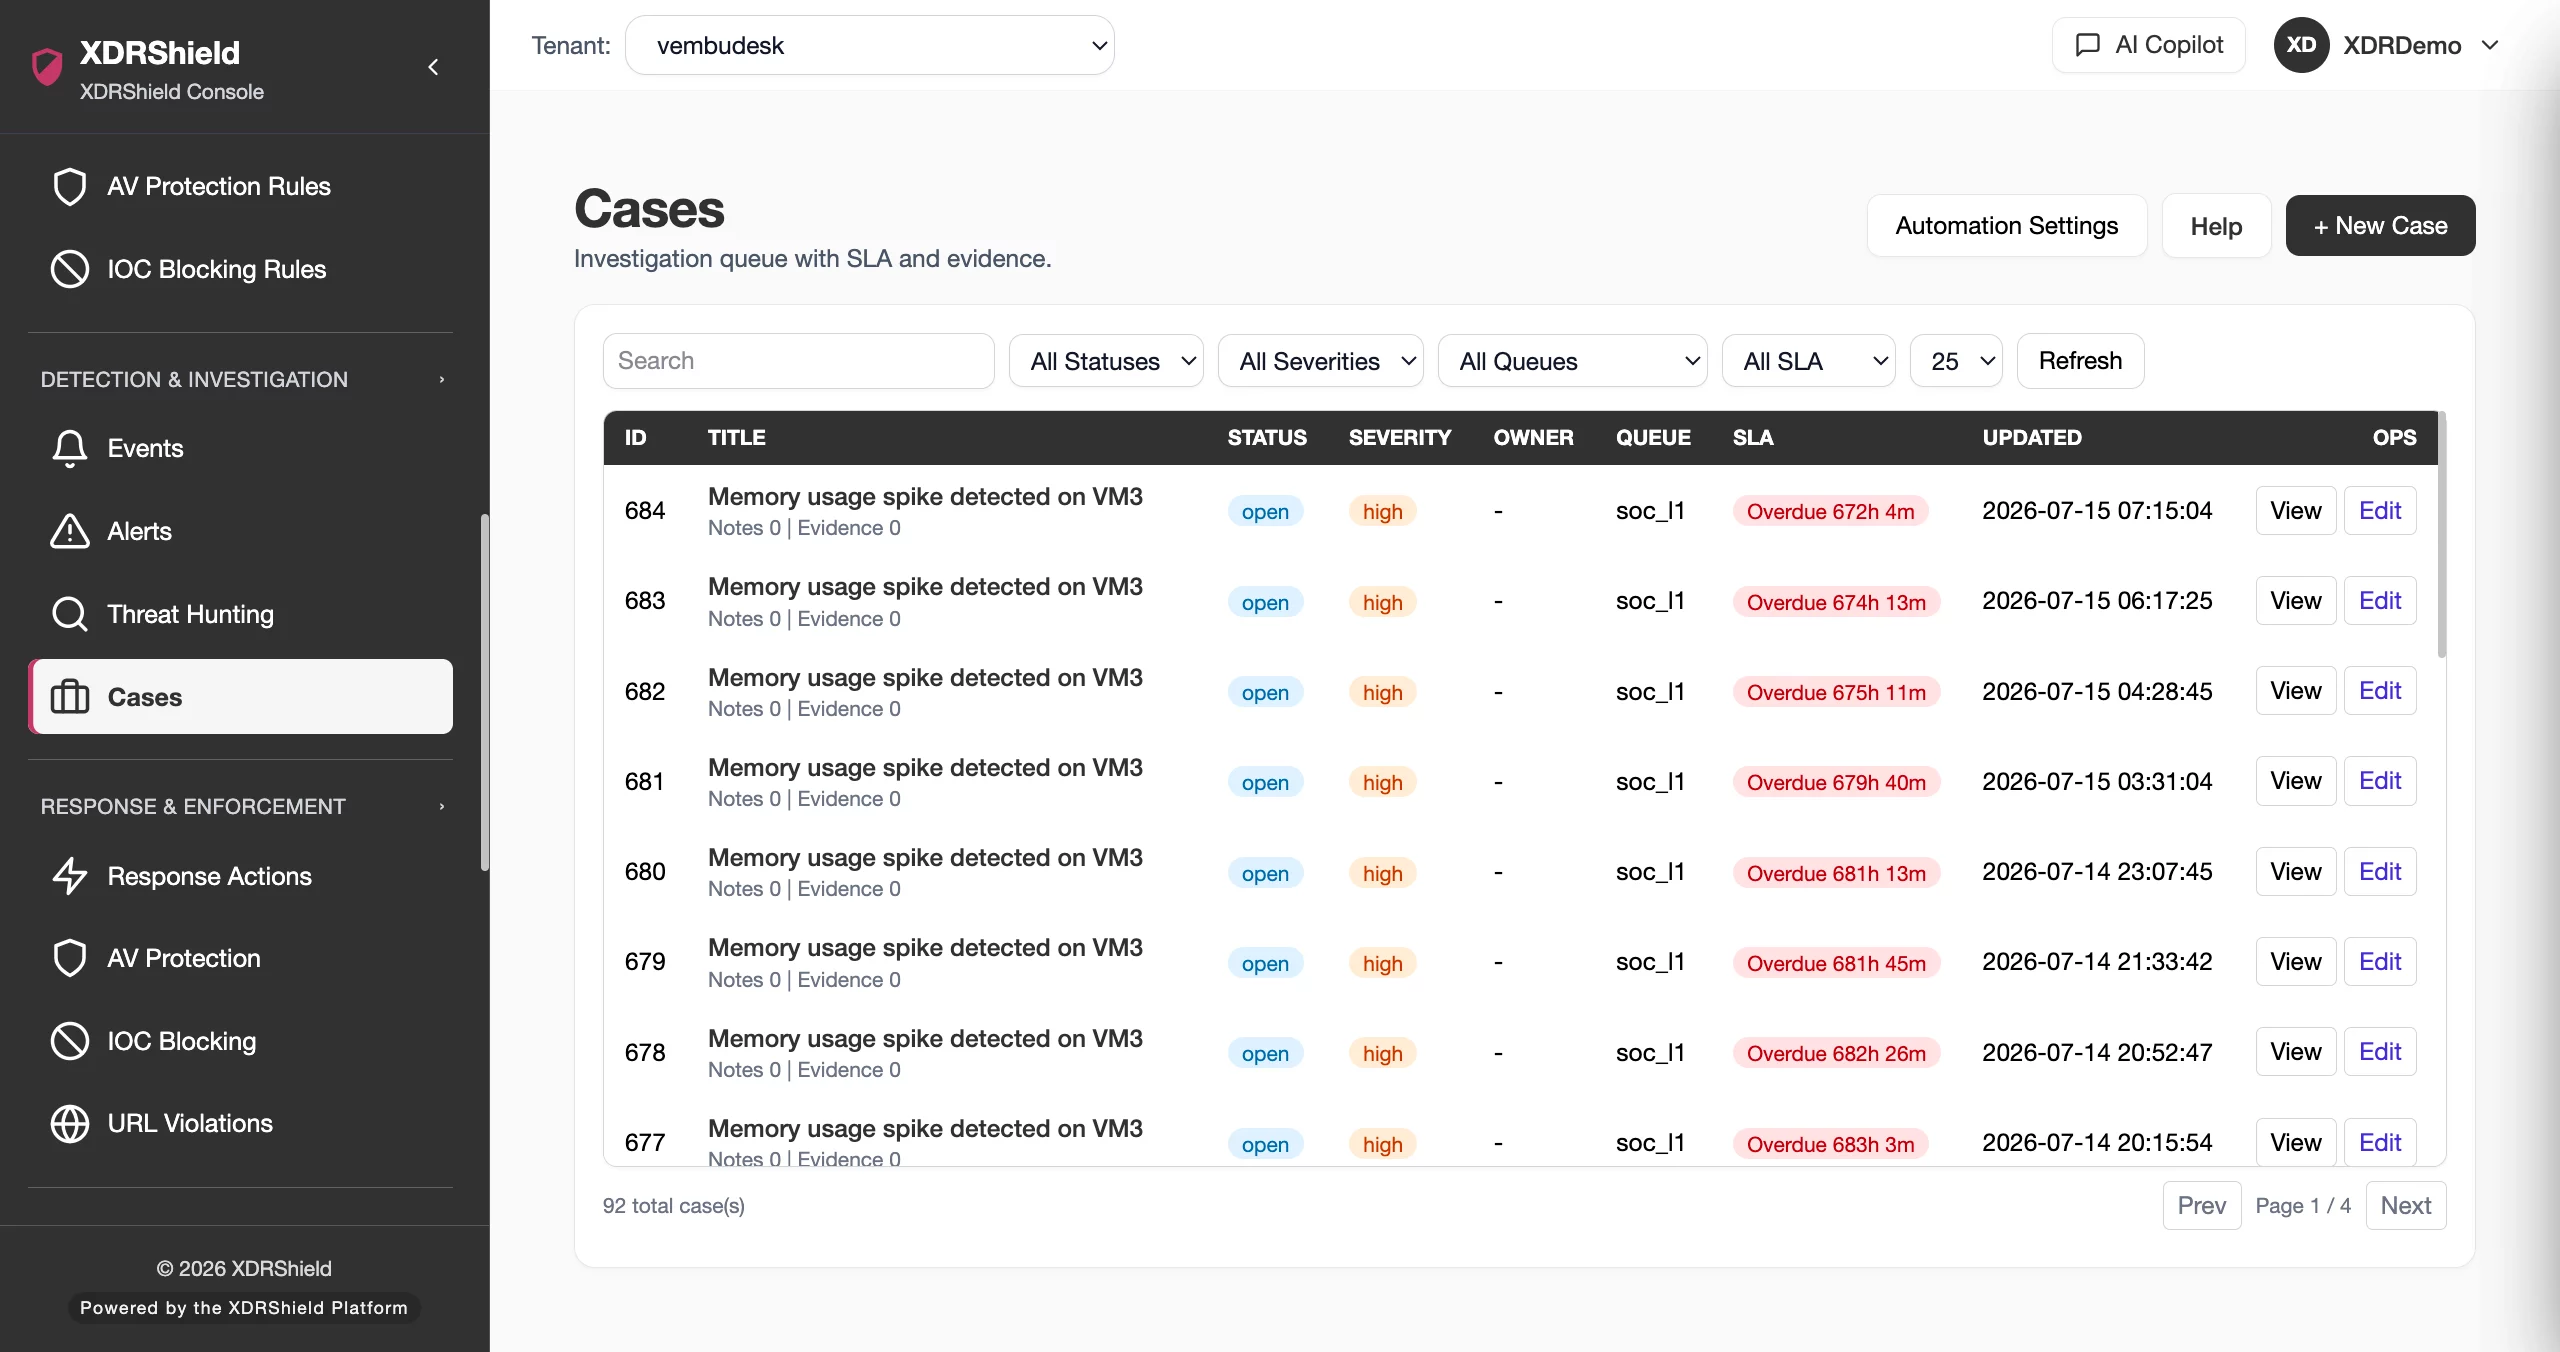
Move from a process event or metric anomaly into threat hunting, case ownership, timelines, and governed response with full evidence context.
Compliance and audit evidence
Preserve process activity records with user context, timestamps, and command-line evidence for compliance and audit workflows.
From process collection to anomaly detection and investigation.
A strong monitoring workflow keeps collection scoping, threshold tuning, anomaly review, and investigation connected so process and metric data is detected, analyzed, and acted on consistently.
Scope collection
Use policies to define which endpoints collect process events and system metrics based on tenant and coverage requirements.
Tune threshold rules
Set CPU, memory, disk, and network thresholds that match normal operational baselines and flag genuine anomalies.
Review process events
Examine process creation, modification, and termination with command-line arguments and parent-child context.
Analyze metric anomalies
Investigate threshold breaches and unusual resource patterns that may indicate crypto-mining or malware.
Correlate with alerts
Connect process and metric events to security alerts, event triage, and case workflows for full context.
Escalate to investigation
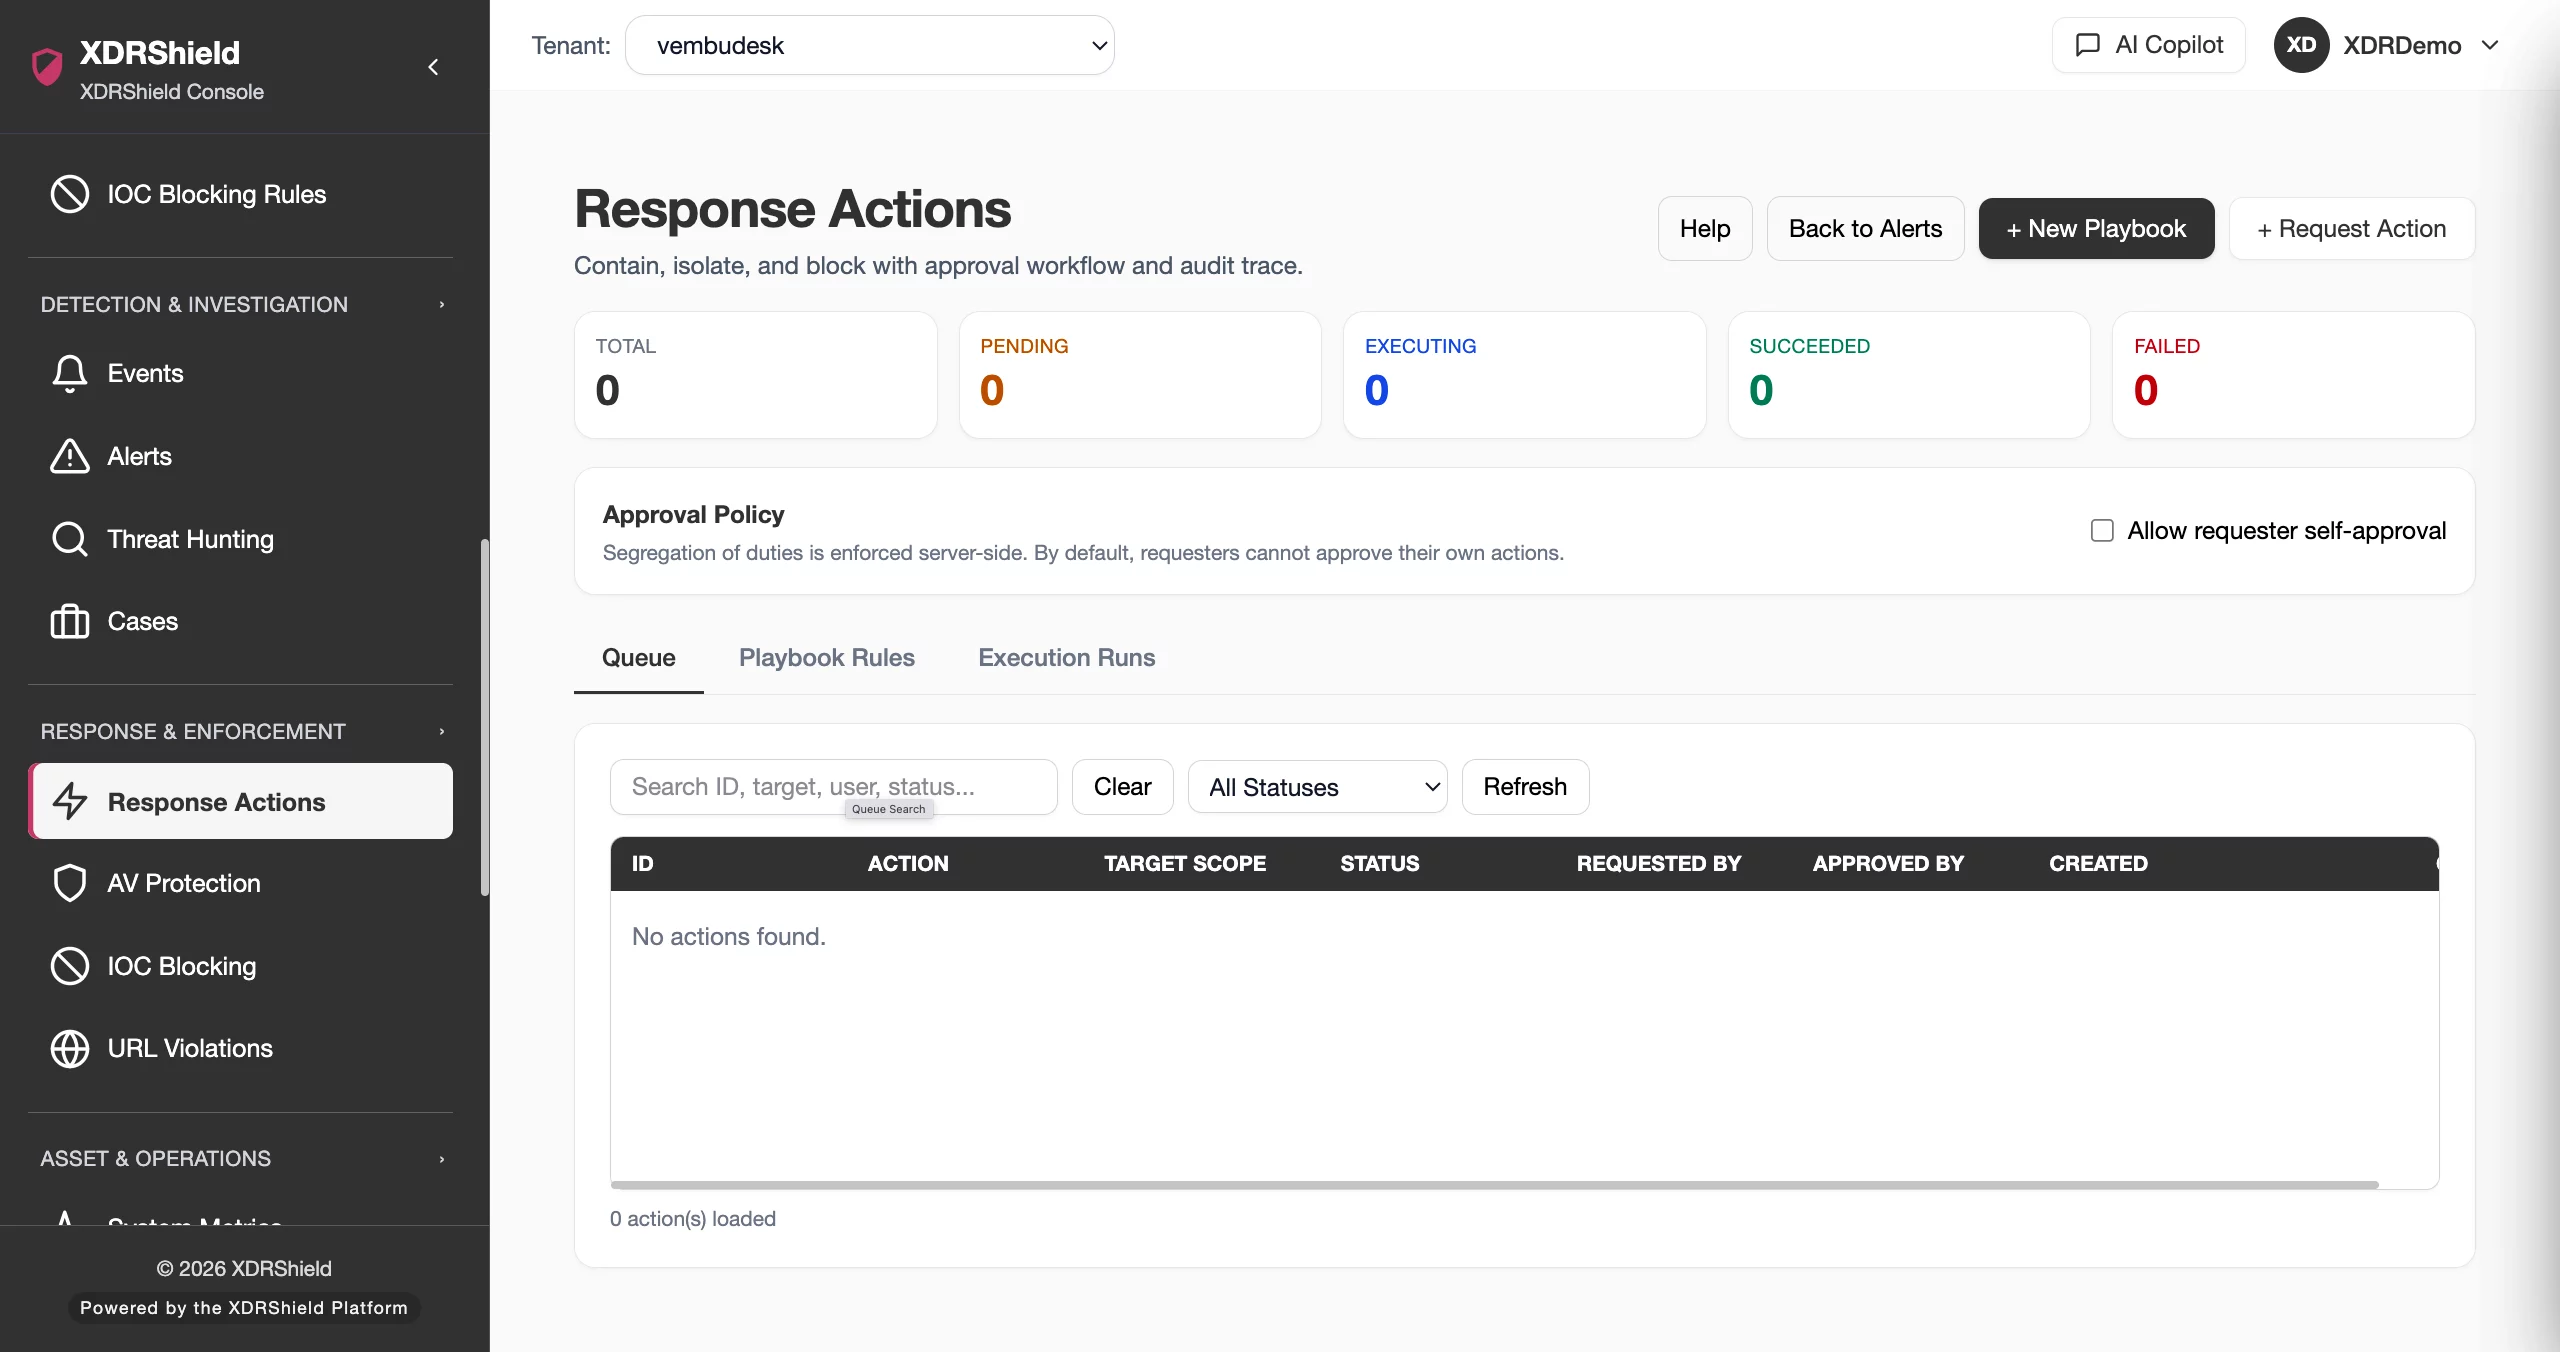
Move from process or metric evidence into threat hunting, case ownership, and governed response with full timelines.
Where Process and System Metrics Monitoring helps most.
Use process and metric monitoring where suspicious behavior or anomalous resource patterns can create security or operational risk.
Suspicious process detection
Identify unexpected shells, scripting engines, and living-off-the-land binaries running outside normal operational context.
Parent-child anomaly detection
Detect unusual process trees, injection patterns, and suspicious parent-child relationships that may indicate compromise.
Resource exhaustion monitoring
Monitor disk filling, memory leaks, and CPU spikes that may indicate operational issues or malware activity.
Crypto-mining and malware detection
Spot anomalous resource patterns consistent with crypto-mining, malware activity, or unauthorized background processes.
Incident timeline reconstruction
Use historical process and metric data to build accurate incident timelines with full process metadata and resource context.
MSP multi-tenant monitoring
Standardize process and metric monitoring policies across customers while keeping tenant-specific data and thresholds separate.
Process and metric monitoring for security, infrastructure, and MSP teams.
The same process and metric evidence supports different decisions. XDRShield keeps collection context, anomaly detection, and audit history usable without losing tenant scope or operational responsibility.
For SOC and investigation teams
Use process events and metric anomalies to detect suspicious behavior, correlate with alerts and file activity, and escalate into hunts, cases, and governed response.
- Connect process events and metric anomalies to alerts and case timelines.
- Review suspicious processes with command-line, parent-child, and user context.
- Escalate anomalous activity into investigation and response.
For MSP and IT operations teams
Standardize process and metric monitoring policies across managed environments while keeping tenant-specific thresholds, review queues, and audit trails separated by customer.
- Apply consistent monitoring policies across customers and tenants.
- Keep tenant-specific metric thresholds and process review separate.
- Use policy-based collection scoping for controlled coverage.
Process and System Metrics Monitoring FAQs.
What is Process and System Metrics Monitoring in XDRShield?
Process monitoring tracks running processes on monitored endpoints including creation, modification, and termination events with command-line arguments, parent-child relationships, and user context. System metrics collects CPU, memory, disk, and network utilization data for operational health and anomaly detection.
How does process monitoring help detect threats?
By capturing full command-line arguments, parent-child process relationships, image paths, and user context, teams can detect suspicious process behavior such as unexpected scripting engines, living-off-the-land binaries, process injection patterns, and unusual process trees that may indicate compromise.
What system metrics are collected?
XDRShield collects CPU usage, memory utilization, disk I/O, and network I/O per endpoint. Threshold-based metric rules can detect anomalous resource patterns that may indicate crypto-mining, resource exhaustion, performance issues, or malware activity.
Can process events be connected to investigation workflows?
Yes. Process events and system metrics can be correlated with security alerts, event triage, threat hunting, case timelines, and governed response so suspicious activity is not reviewed in isolation.
How does process monitoring support MSP operations?
MSP teams get per-customer process visibility with policy-based collection scoping, tenant-specific alert thresholds, and separated audit trails across customers, tenants, and workspaces.
Track process behavior, detect metric anomalies, and connect evidence to investigation.
Use XDRShield Process and System Metrics Monitoring to detect suspicious process activity, spot anomalous resource patterns, reconstruct incident timelines, and connect process and metric evidence to alerts, cases, and governed response.